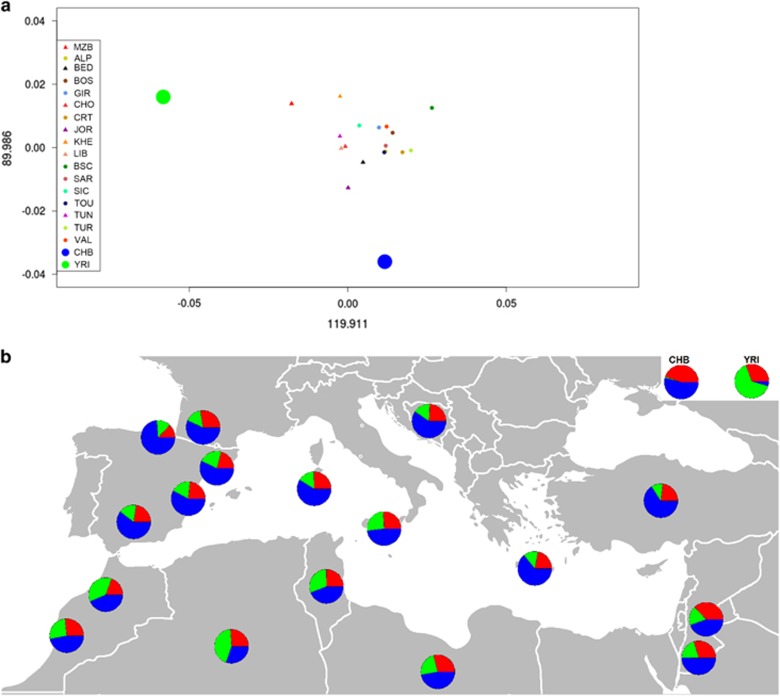
Figure 3.
(a) PCA based on allele frequencies. Big green and red points are the centroids of YRI and CHB populations, respectively. Triangles represent the centroids of North African populations, whereas small circles represent the centroids of the Southern European populations. (b) Admixture analysis for K=3 ancestral components represented as pie charts. The pie chart of each population is located on its geographic position. ALP, Las Alpujarras; BED, Bedouin; BOS, Bosnia-Herzegovina; BSC, Basque Country; CHB, Han Chinese from Beijing; CHO, Chouala; CRT, Crete; GIR, Girona; JOR, Jordan; KHE, Khenifra; LIB, Libya; MZB, M'zab;SAR, Sardinia; SIC, Sicily; TOU, Toulouse; TUN, Tunisia; TUR, Turkey; VAL, Valencia; YRI, Yoruba. A full colour version of this figure is available at the European Journal of Human Genetics journal online.

