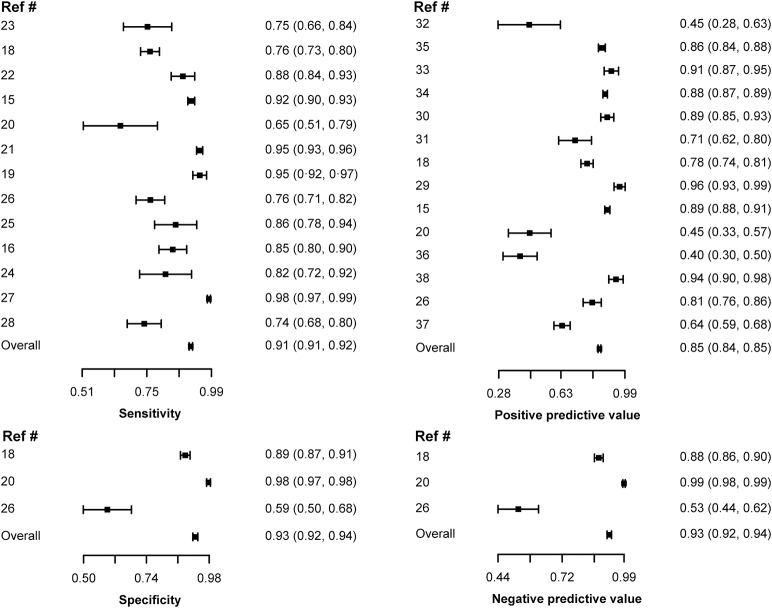
Figure 2. Emergency department (ED) diagnostic accuracy for acute cerebrovascular events by study: Sensitivity, specificity, positive predictive values (PPV), and negative predictive values (NPV).
Forest plots show sensitivity, specificity, PPV, and NPV (mean [95% confidence interval]) in ED diagnosis of cerebrovascular events. Results are shown by study and pooled. Note significant heterogeneity across studies, discussed in the text.

