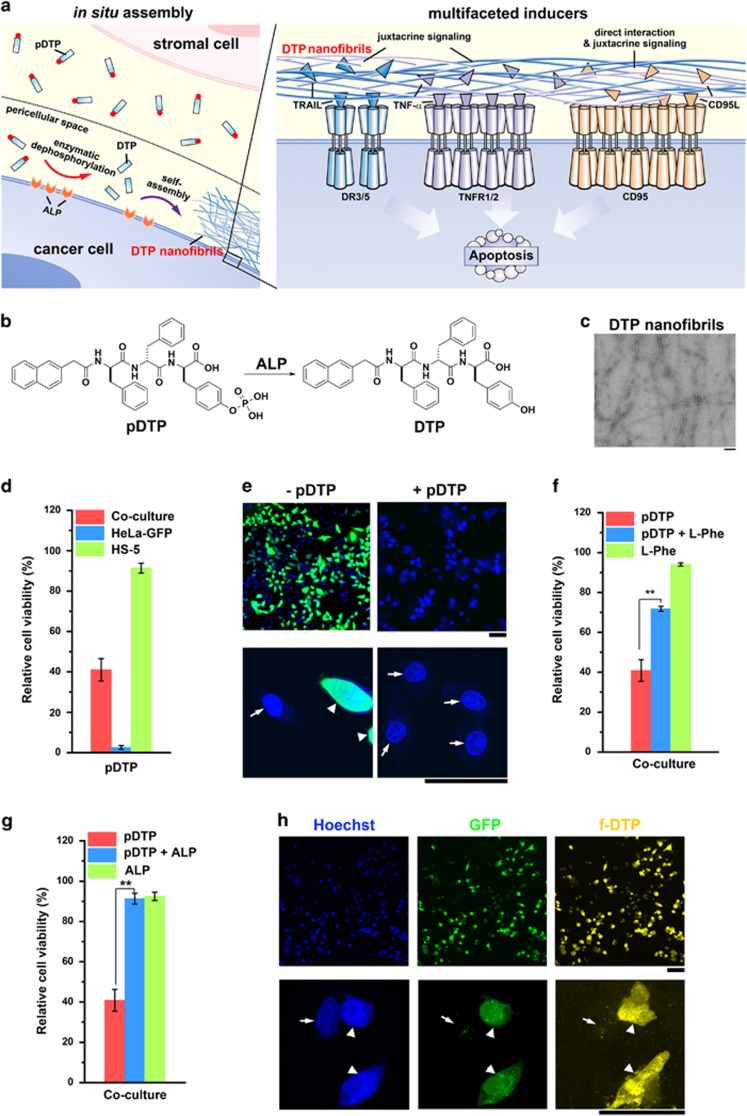
Figure 1.
Enzyme in situ generates pericellular D-peptide nanofibrils for selectively inhibiting cancer cells in co-culture. (a) The illustration of the pericellular DTP nanofibrils formed by enzyme-instructed self-assembly (EISA) to selectively inhibit cancer cells in co-culture via promiscuously activating cell death signaling. (b) Chemical structures of the precursor (pDTP), the self-assembly tripeptide (DTP), and the dephosphorylation of the precursor catalyzed by PLAP. (c) Transmission electron microscopic (TEM) images of DTP nanofibrils formed by the addition of alkaline phosphatase (5 U/ml) to the solution of pDTP at the concentration of 362 μg/ml. (d) Relative cell viability of the co-cultured cells (HS-5 and HeLa-GFP cells), HeLa-GFP, or HS-5 incubated with pDTP. The initial number of cells is 1.0 × 10⁴/well (e.g., 1.0 × 10⁴ HeLa-GFP or HS-5 cells, or mixture of 5.0 × 10³ HeLa-GFP cells and 5.0 × 10³ HS-5 cells) and [pDTP]=216 μg/ml. (e) The fluorescent images of low (top) or high (bottom) magnification of co-cultured cells incubated with or without pDTP (362 μg/ml) for 48 h. Blue indicates all the live cells stained by Hoechst 33342 (1 μg/ml, 5 min) before fluorescent imaging; green indicates the live HeLa-GFP cells. The initial number of cells is 1.0 × 10⁵/well. Relative cell viability of the co-cultured HS-5 and HeLa-GFP cells (f) incubated with pDTP, pDTP+L-Phe, or L-Phe, or (g) incubated with pDTP, pDTP+AP, or AP in DMEM for 48 h. The initial number of cells is 1.0 × 10⁴/well and [pDTP]=216 μg/ml, [L-Phe]=1.0 mM, [AP]=0.1 U/ml. n=3. Data are shown as mean±S.D. *P<0.05, **P<0.01 by Student's t-test. (h) The fluorescent images of low (top) or high (bottom) magnification of co-cultured cells incubated with f-pDTP (493 μg/ml) for 4 h. Blue indicates all the live cells stained by Hoechst 33342; green indicates the live HeLa-GFP cells; and yellow indicates the peptide nanofibrils of f-DTP. The initial number of cells is 1.0 × 10⁵/well. The scale bars are 100 nm in (c), 100 μm in (top of (e) and (h)), 50 μm in (bottom of (e) and (h)). Bottom row of (e) and (h): white arrows point at HS-5, and arrow heads at HeLa-GFP

