Figure 5.
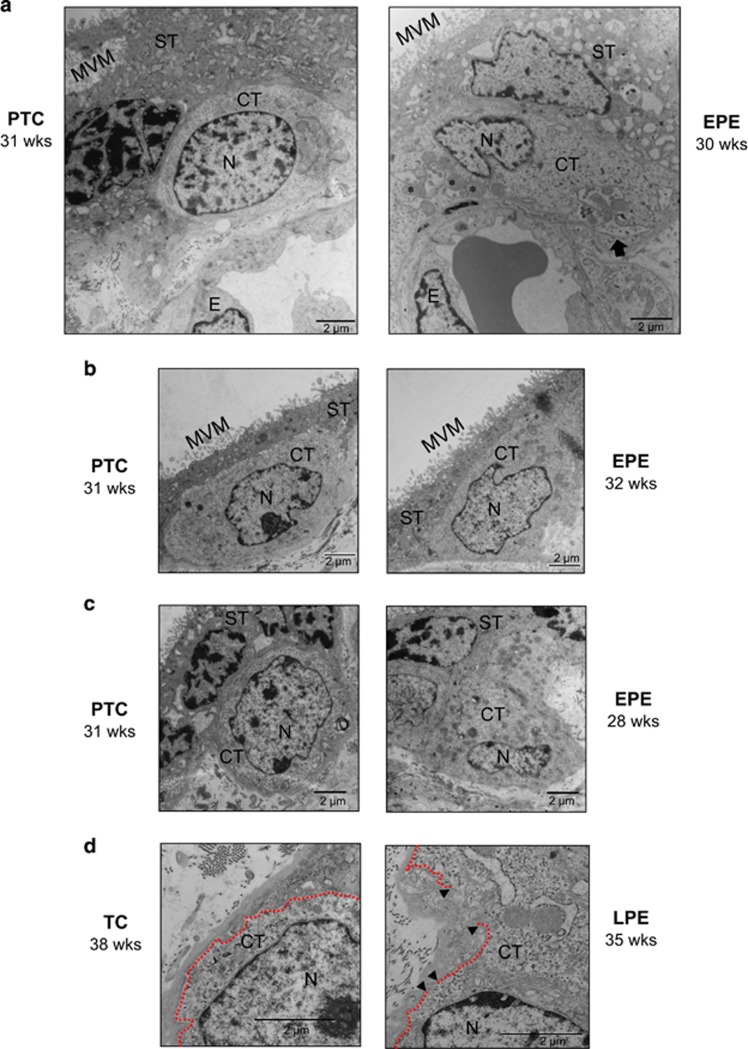
Preeclampsia is associated with necroptotic cytotrophoblast cell morphology. (a) TEM analysis of PTC and PE placental tissue sections. Necrosis morphology was identified based on swollen mitochondria (indicated by asterisks), loss of cytoplasmic electron density, and membrane disruptions. An arrow designates evidence of mitophagy in the PE sample. (b and c) Representative TEM images of cytotrophoblast cells from E-PE and PTC placentae, showing loss of chromatin organization (chromatin decondensation), aberrant nuclear morphology and loss of cytoplasmic electron density in PE samples compared with PTC. (d) Representative TEM images from L-PE and TC placentae showing discontinuous cell membrane of necrotic cytotrophoblasts from PE placentae, as occurs in the final stages of necrosis. This is depicted by gaps (indicated by black arrowheads) in the plasma membrane (depicted with dashed line). CT, cytotrophoblast; E, endothelial cell; MVM, microvillous membrane; N, nucleus; ST, syncytiotrophoblast. Scale bars=2 μm

