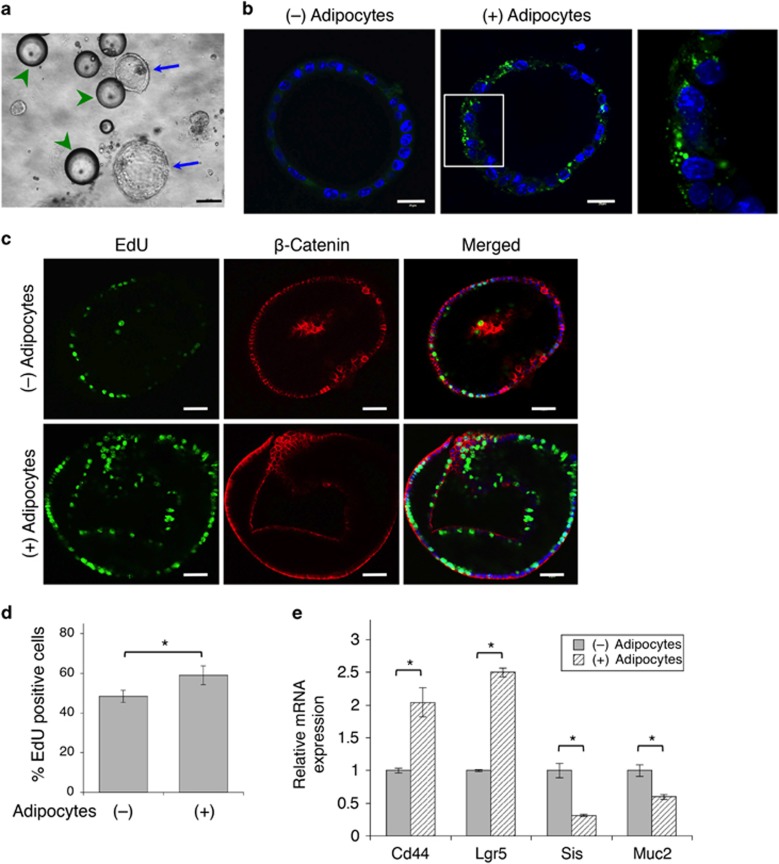
Figure 5.
Adipocytes promote cell proliferation in tumor organoids. (a) Phase contrast image of tumor organoids derived from Apcf/f/KrasG12V/Vil-Cre mice embedded with mouse adipocytes in 3D Matrigel. Tumor organoids are marked by blue arrows whereas adipocytes are indicated by green arrowheads. Scale bar, 100 μm. (b) Tumor organoids were embedded with or without mouse adipocytes in 3D Matrigel for 48 h. Lipid droplets in cells were detected using BODIPY-493/505 staining (green) and cell nuclei were stained with DAPI. Scale bar, 20 μm. The panel on the right is the enlarged image of the boxed region shown in the middle. (c) Tumor organoids embedded with or without mouse adipocytes in 3D Matrigel were labeled with EdU (green) and subsequently fixed and stained with the anti-β-catenin antibody (red) and DAPI (blue). Scale bar, 40 μm. (d) Proliferative index was expressed as the percentage of EdU-positive cells in 15 randomly chosen organoids. Data represent the mean±S.D. (*P<0.0001). (e) Adipocytes induce dedifferentiation of colon cancer cells. Tumor organoids as treated in a were analyzed for mRNA expression of Lgr5, Cd44, Sis and Muc2 using qRT-PCR. Data represent the mean±S.D. (*P<0.0001)

