Figure 4.
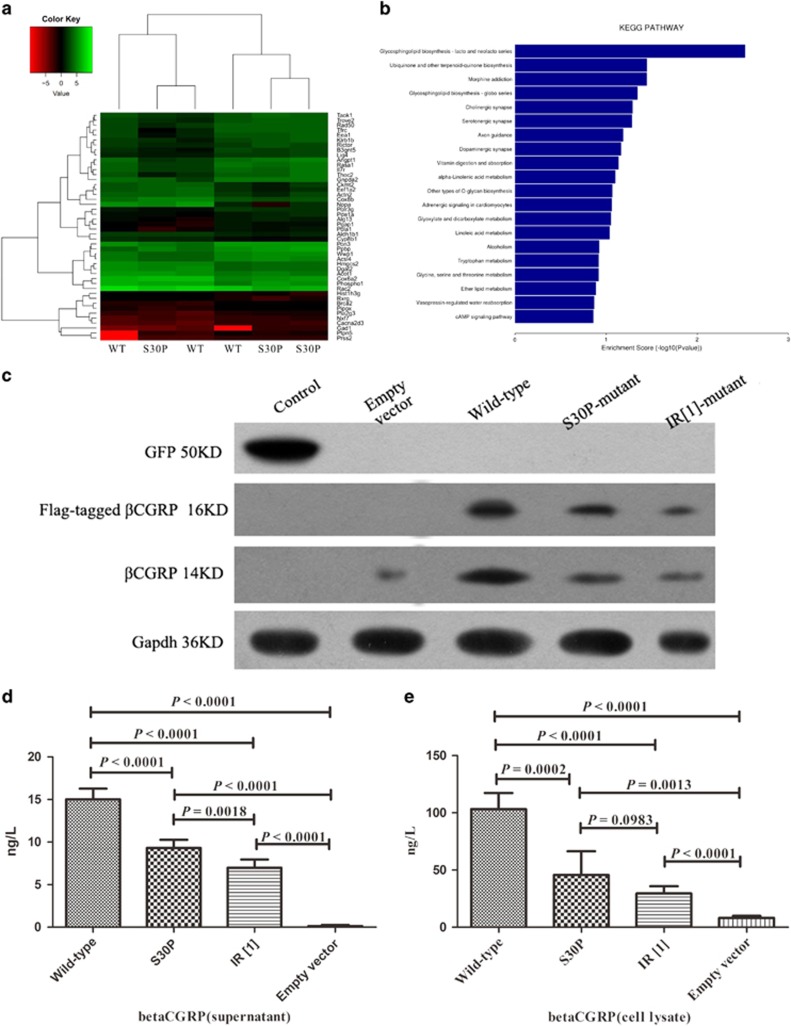
Identification of the differentially expressed genes of HEK 293 cells transfected with wild-type and mutants of CALCB. (a) Heat map demonstrating the most robust changes in the transcriptome of CALCB p.S30P and wild-type transfected HEK 293 cells (n=3). Color depth in the heatmap represents the different expression levels. Color key indicates metabolite expression value, blue: lowest; red: highest. (b) Importantly, KEGG pathway mapping of the entire set of differentially expressed genes revealed highly significant molecular interactions for KEGG. X-axis is an inverse indication of significance. (c) The expression of βCGRP in HEK 293 cells transfected with empty vector, wild-type CALCB, S30P, and IR [1]-mutants. Western blot was carried out with the use of antibodies against βCGRP or Flag. (d) The concentrations of βCGRP in the supernatant. (e) The concentrations of βCGRP in the cell lysate

