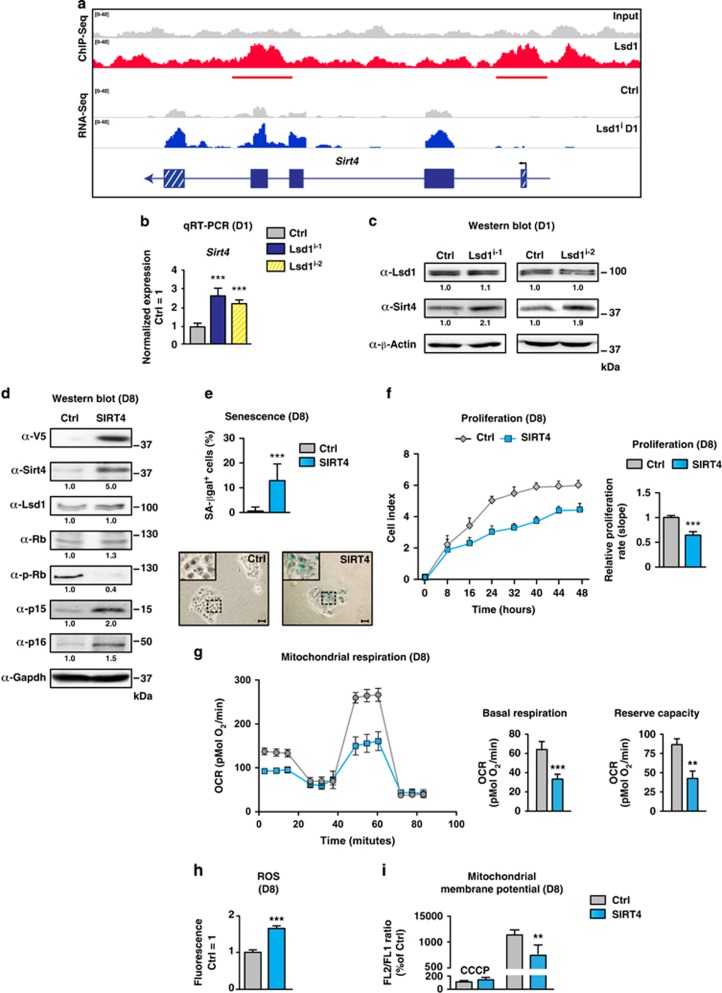
Figure 4.
Sirt4 triggers senescence in TSCs. (a–c) Comparison of TSCs cultured for 24 h in the presence of solvent (Ctrl), Lsd1 inhibitor 1 (Lsd1i-1) (a–c) and Lsd1 inhibitor 2 (Lsd1i-2) (b and c). (a) Localization of Lsd1 at the Sirt4 gene and differential Sirt4 transcription. (b and c) Quantification of Sirt4 expression by qRT-PCR (b) and western blot (c). Data were normalized to three housekeeping genes (b) and β-actin as loading control relative to the Ctrl (c). (d–i) Comparison of TSCs transfected with an empty vector (Ctrl) or SIRT4 expression plasmid. (d) Western blot for the indicated antibodies including V5-tagged SIRT4 and phosphorylated Rb (p-Rb). Band intensity was normalized to Gapdh relative to the Ctrl. (e) Quantification of senescent cells and representative images of senescent-associated β-galactosidase activity (blue) in TSCs. (f) Proliferation of TSCs was determined in real time. (g) Mitochondrial respiration was determined by a time course of OCR. Complex V was blocked by oligomycin (O), uncoupling was induced by FCCP (F) and electron transport system was disabled by addition of rotenone (R) and antimycin A (A). Basal respiration is the difference of the OCR in the absence of inhibitors and after addition of rotenone and antimycin A. The reserve capacity is derived from the subtraction of the OCR after addition of rotenone and antimycin A from oligomycin-treated TSCs. (h) Relative quantification of ROS using fluorescent dye. (i) Relative mitochondrial membrane potential determined by FL2/FL1 ratio. The background level was assigned by depolarization with CCCP. Data were analyzed from at least three biological samples and are represented as mean+S.E.M. **P<0.01; ***P<0.001 (unpaired, two-tailed Student's t-test, (b, e and f–i))

