Figure 2.
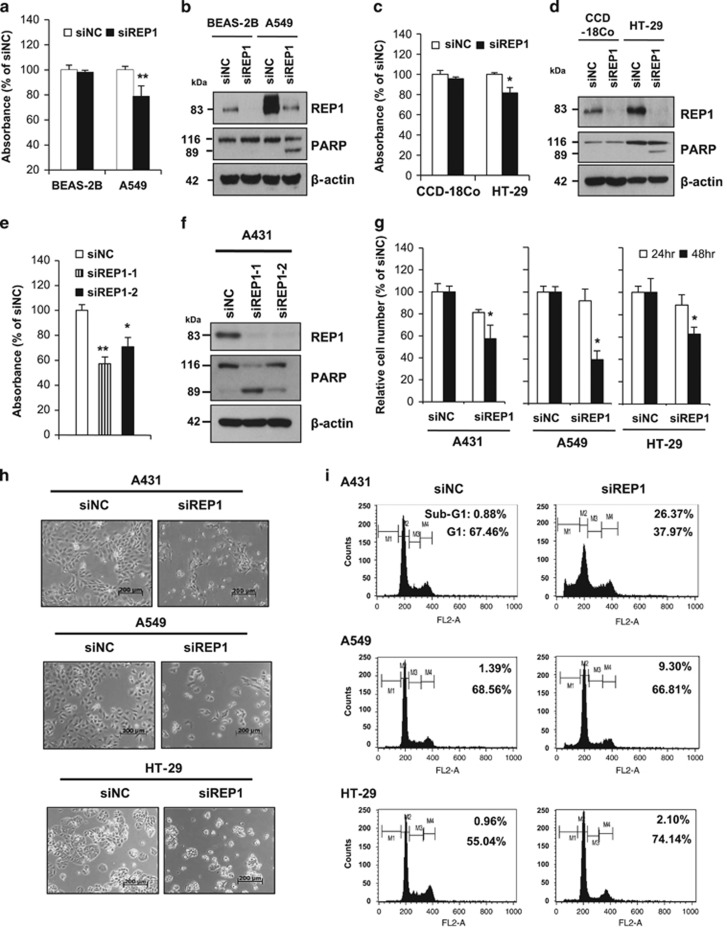
Effects of REP1 knockdown on cell growth and apoptosis. (a and b) BEAS-2B and A549 cells were transfected with either siNC or siREP1. Cell growth was measured by MTS assay at 48 h after transfection, with error bars representing S.D. (versus siNC, **P<0.01) (a) and cellular proteins were subjected to immunoblot analysis using indicated antibodies (b). (c and d) CCD-18Co and HT-29 cells were transfected with either siNC or siREP1. Cell growth was measured by MTS assay at 48 h after transfection, with error bars representing S.D. (versus siNC, *P<0.05) (c) and cellular proteins were subjected to immunoblot analysis using indicated antibodies (d). (e) A431 cells were transfected with either non-specific control siRNAs (siNC) or two different siRNAs specific for REP1 (siREP1-1 and siREP1-2) and cell growth was measured by MTS assay at 48 h after transfection, with error bars representing S.D. (versus siNC, *P<0.05, **P<0.01). (f) A431 cells were treated as in e and cell lysates were subjected to immunoblot analysis using anti-REP1, -PARP, and -β-actin antibodies. (g, h and i) A431, A549, and HT-29 cells were transfected with either siNC or siREP1. Live cells were counted by trypan blue staining, with error bars representing S.D. (versus siNC, *P<0.05) (g), cell images were taken using phase contrast microscopy. Magnification: × 50; scale bar=200 μm (h), or cells were subjected to Sub-G1 analysis by flow cytometry (M1, sub-G1 phase; M2, G1 phase; M3, S phase; M4, G2/M phase) (i). Similar results were observed in three independent experiments

