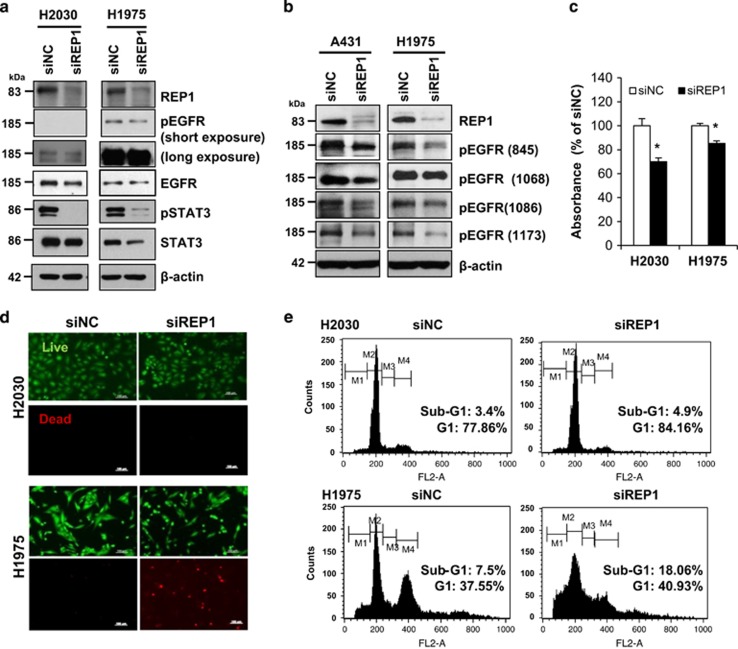
Figure 4.
Effects of REP1 knockdown on NSCLC with EGFR mutation. (a) H2030 and H1975 cells were transfected with either siNC or siREP1 for 48 h and cell lysates were subjected to immunoblot analysis using indicated antibodies. (b) A431 and H1975 cells were transfected with either siNC or siREP1 for 48 h and cell lysates were processed for immunoblot analysis using anti-phospho-EGFR antibodies specific for tyrosine residues at 845, 1068, 1086, and 1173, respectively. (c, d and e) H2030 and H1975 cells were transfected with siRNAs as in a, followed by MTS assay, with error bars representing S.D. (*P<0.05) (c), live/dead analysis by staining with calcein-AM and PI (d), and cell cycle analysis by flow cytometry (e). Images were taken by fluorescence microscopy. Magnification: x100; Scale bar=100 μm. (M1, sub-G1 phase; M2, G1 phase; M3, S phase; M4, G2/M phase). Similar results were observed in three independent experiments

