Figure 5.
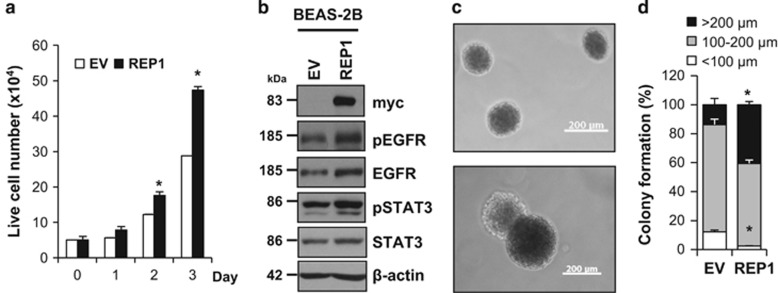
Effects of REP1 overexpression on normal cell growth. (a and b) BEAS-2B cells were transfected with either EV or REP1-myc plasmid. To assess cell growth, transfected cells were stained with trypan blue and trypan blue negative cells were counted as live cells, with error bars representing S.D. (versus EV, *P<0.05) (a). Cell lysates at 72 h were subjected to immunoblot analysis using indicated antibodies (b). (c and d) BEAS-2B cells transfected empty vector or REP1-myc plasmid were subjected to soft agar colony-formation assay. Representative colony images were taken using phase contrast microscopy. Magnification: × 50, Scale bar=200 μm (c). Colony sizes were measured and summarized in the histogram, with error bars representing S.D. (versus EV, *P<0.05) (d). Similar results were observed in three independent experiments

