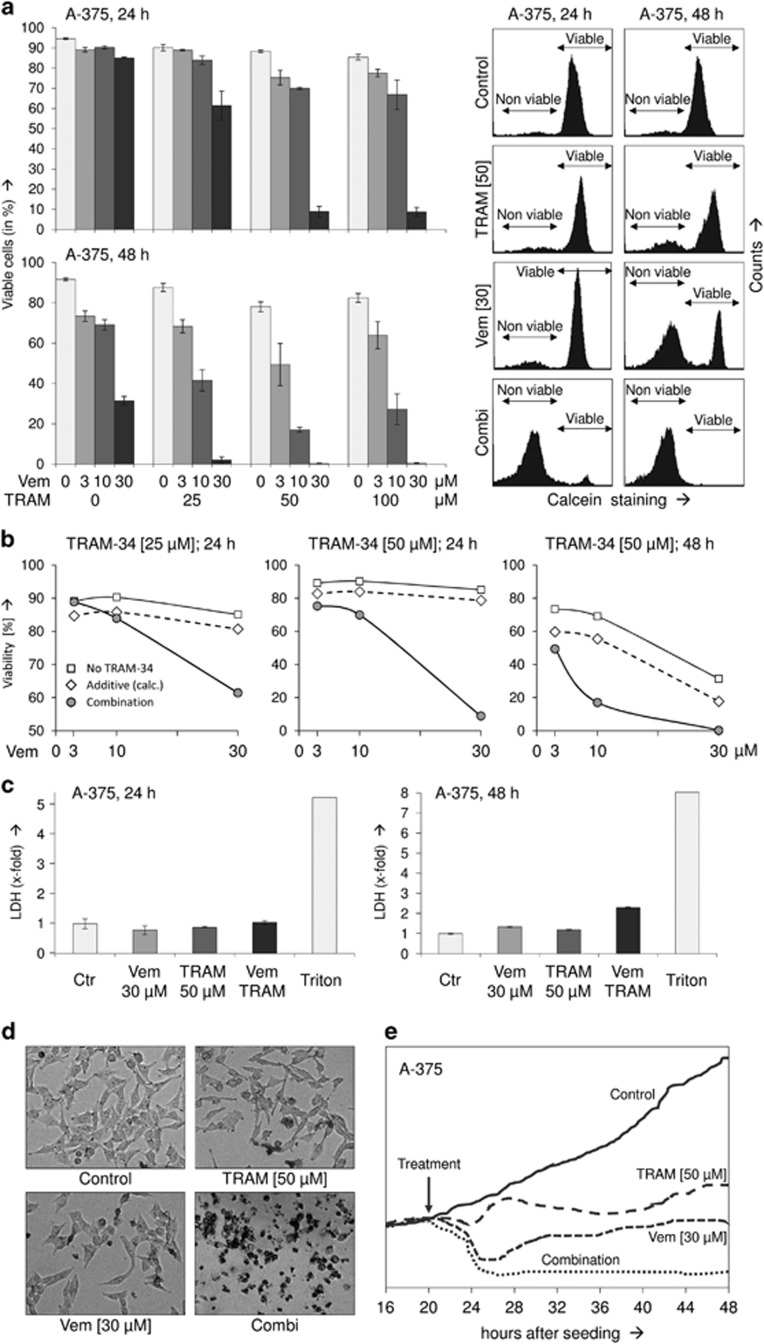
Figure 2.
(a) Cell viability was determined by calcein staining in A-375 cells at 24 and 48 h in response to vemurafenib (Vem; 3, 10, 30 μM) and TRAM-34 (TRAM; 25, 50, 100 μM). Effects on cell viability with the selected concentrations of 30 μM Vem and 50 μM TRAM have been reproduced at least two times. Examples of calcein-stained cells are given on the right side. Non-viable and viable cell populations are indicated. (b) For three conditions (24 h, TRAM-34 25 μM and 50 μM; 48 h, TRAM-24 50 μM), calculated additive effects on viability (diamond symbols) are directly compared with experimentally determined combination effects (circle symbols, corresponding to panel (a)). Calculated additive effects result from addition of the negative effects by vemurafenib and TRAM-34. For further comparison, effects by vemurafenib alone (3, 10, 30 μM) is shown (square symbols). (c) Relative cytotoxicity was determined by quantification of released LDH. Cells completely lysed by triton-x100 treatment (Triton) served as positive controls (triplicate values, >2 independent experiments). (d) Rounded and detached cells were characteristic of combination treatment at 24 h. (e) Adherent cells corresponding to cell proliferation were determined in real time by the xCELLigence system (triplicate values). Time of treatment is indicated by an arrow

