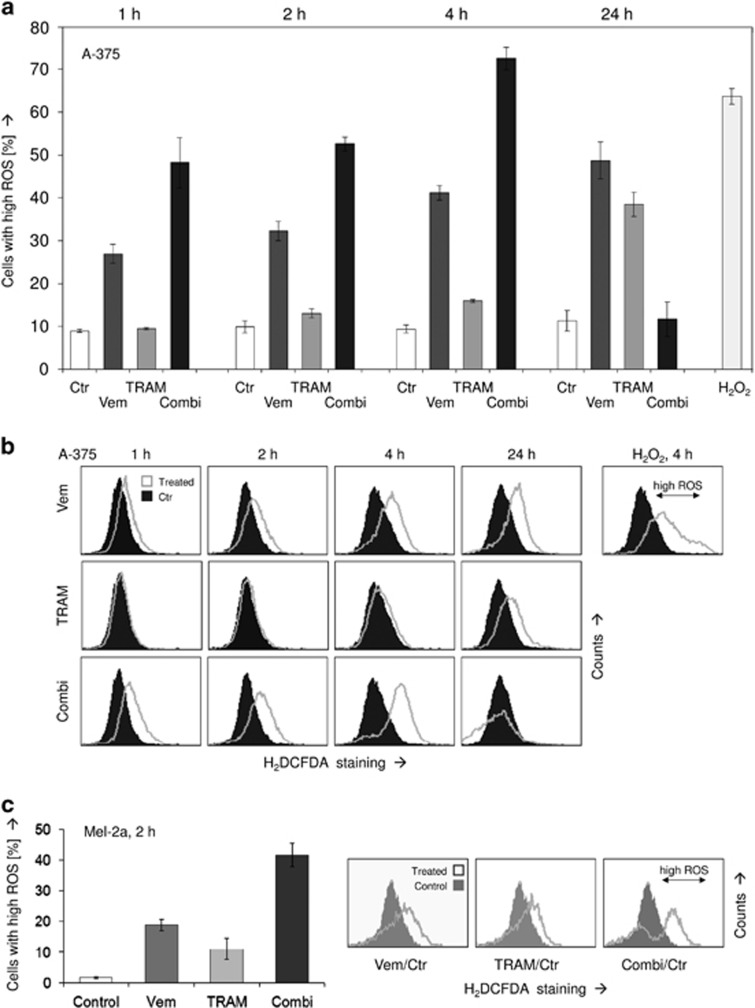
Figure 4.
(a) Intracellular levels of ROS were determined in A-375 at 1, 2, 4 and 24 h of treatment with 30 μM vemurafenib (Vem), 50 μM TRAM-34 (TRAM) and the combination. The assay is based on staining with the ROS-sensitive dye H2DCFDA and subsequent flow cytometry. (b) Examples of treated cells versus controls are given. H2O2-treated cells served as positive control; cells with high ROS are indicated. The experiment was performed in triplicates; at 2 and 4 h, at least two independent experiments revealed highly comparable results. (c) Increased ROS levels are shown in Mel-2a at 2 h in response to vemurafenib (30 μM), TRAM-34 and the combination. Examples are shown on the right side (triplicate determinations, two experiments)

