Figure 1.
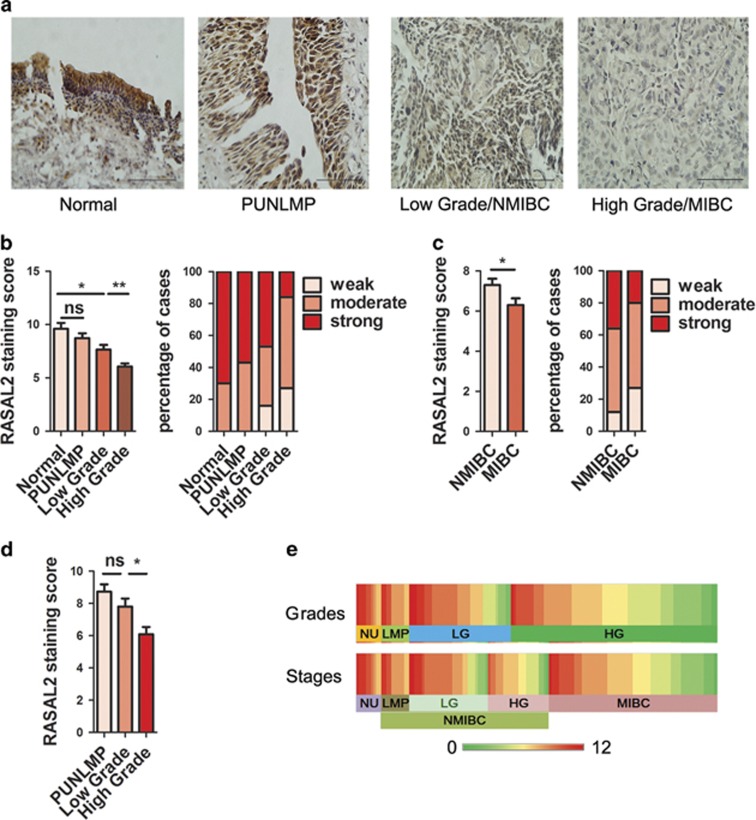
Expression of RASAL2 in BCa tissues. (a) Representative pictures of IHC staining of RASAL2 in normal urothelium, papillary urothelial neoplasm of low malignant potential (PUNLMP), low grade/NMIBC and high grade/MIBC. The scale bar represents 100 μm. (b and c) Quantification and percentage analysis of RASAL2 staining in normal urothelium and BCa tissues with different grades (b) and stages (c) were shown. Normal urothelium (NU, n=10), PUNLMP (LMP, n=11), low-grade BCa (LG, n=40), high-grade BCa (HG, n=81), NMIBC (n=66) and MIBC (n=66). (d) Quantification analysis of RASAL2 staining in NMIBC tissues with different grades. (e) Heatmap for IHC of RASAL2 staining in BCa tissues with different grades and stages. *P<0.05, **P<0.01

