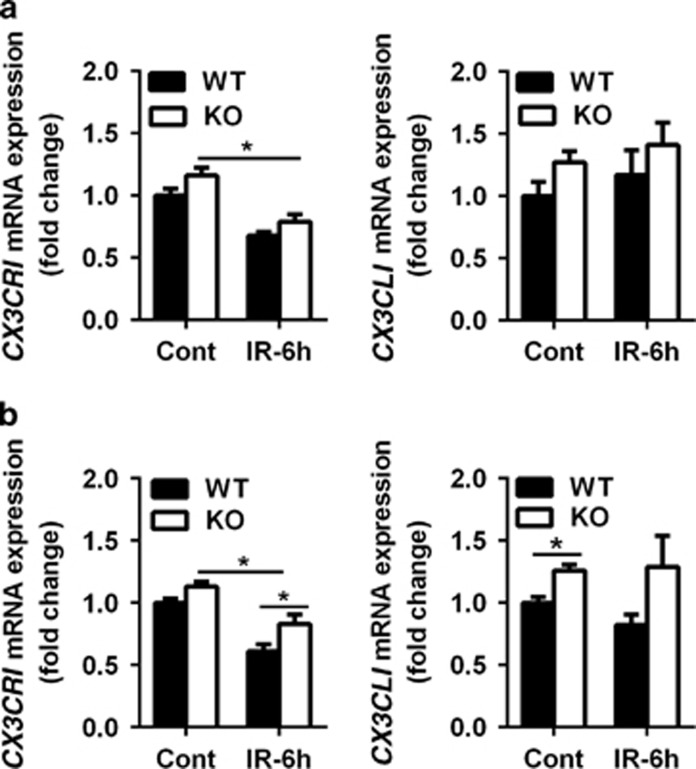
Figure 6.
The mRNA expression of activated microglia-related genes. (a) Bar graphs showing mRNA expression of CX3CR1 and CX3CL1 in the dentate gyrus at 6 h after irradiation. (b) Bar graphs showing mRNA expression of CX3CR1 and CX3CL1 in the cerebellum at 6 h after irradiation; n=5 per group. *P<0.05

