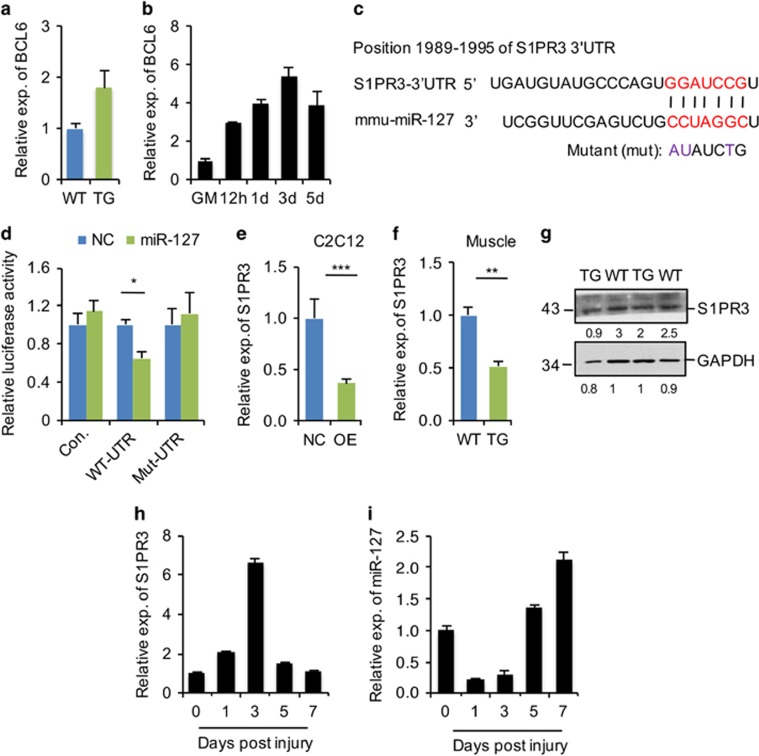
Figure 4.
S1PR3 is a target of miR-127 both in vitro and in vivo. (a) Quantitative real-time polymerase chain reaction (qRT-PCR) analysis of BCL6 gene expression in TA muscle from 8-week-old WT and miR-127 TG mice. The data were normalized using GAPDH. BCL6 expression levels were further normalized to the expression level of WT, defined as 1. (b) Quantification of BCL6 mRNA in C2C12 cells grown in growth media (GM) and the indicated days during differentiation, determined by qRT-PCR. The data were normalized using GAPDH. BCL6 expression levels were further normalized to the expression level of GM, defined as 1. (c) Sequence alignment shows the target sites of miR-127 in the 3′-UTR of mouse S1PR3, as predicted by miRWalk. A mutation in the seed matches is indicated by ‘mut'. (d) miR-127 directly repressed WT S1PR3 3′-UTR in luciferase assays in HEK293 cells, and the repression was abolished by mutation of the miR-127 binding site in the S1PR3 3′-UTR. The values are means±S.E. from three independent experiments. (e) Quantification of S1PR3 mRNA levels in miR-127-OE and control (NC) C2C12 cells by qRT-PCR. The data are a representative of three independent experiments, each performed in triplicate. The data were normalized using GAPDH. S1PR3 expression levels were further normalized to the expression level of NC, defined as 1. (f) S1PR3 mRNA levels in TA muscle from 8-week-old WT and miR-127 TG mice, determined by qRT-PCR (n=5 mice per genotype). The data were normalized using GAPDH. S1PR3 expression levels were further normalized to the expression level of WT, defined as 1. (g) Western blot analysis of S1PR3 protein in TA muscles of 8-week-old WT and miR-127 TG mice. The numbers below each blot represent quantified signal intensities of individual bands. (h) qRT-PCR analysis of S1PR3 in TA muscle at the indicated days after CTX-induced injury (n=3 mice per genotype). The data were normalized using GAPDH. S1PR3 expression levels were further normalized to the expression level of 0 days, defined as 1. (i) qRT-PCR analysis of miR-127-3p in the same samples described in panel h. The data were normalized using U6. miR-127 expression levels were further normalized to the expression level of 0 days, defined as 1. Values in graphs represent means±S.E. *P<0.05; **P<0.01; and ***P<0.001

