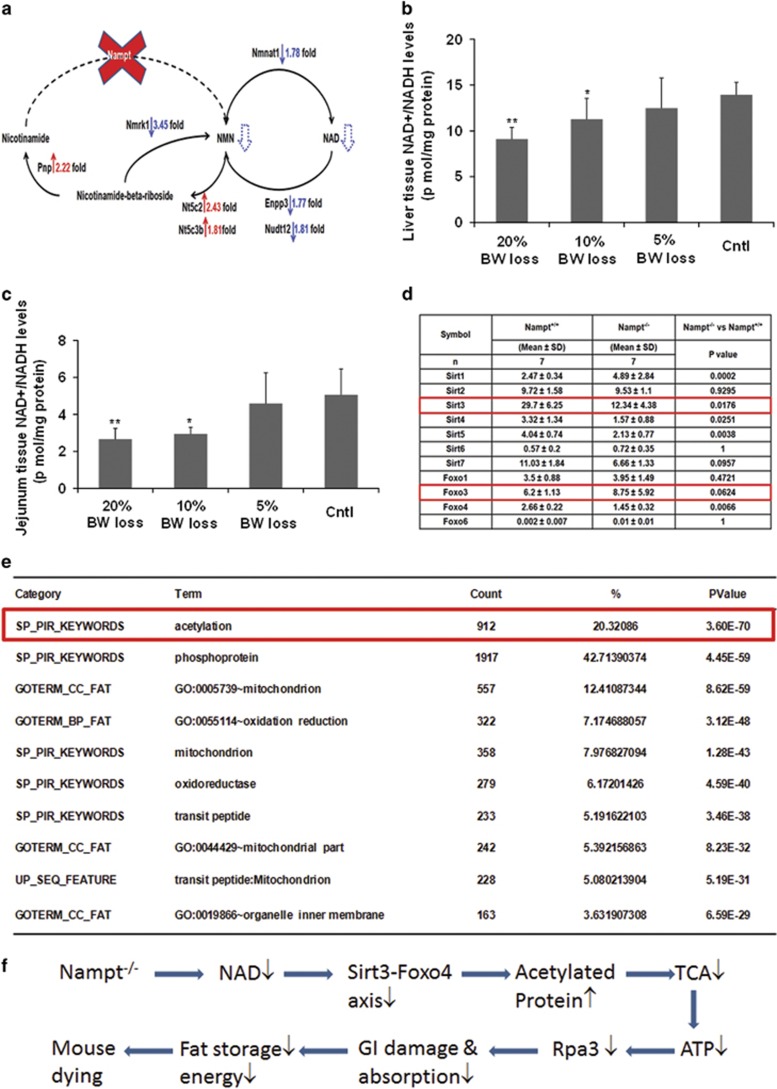
Figure 5.
NAD metabolism and NAD-involved gene expression. (a) NAD synthesis from Nampt catalyzed salvage pathway and its metabolism in Nampt−/− mice. Solid red arrows indicate gene upregulation while blue arrows indicate gene downregulation. Blue dotted arrows indicate reduced metabolite production. (b) Mouse liver NAD levels. Mouse liver tissues (30 mg) were homogenized and the supernatants were taken for NAD+/NADH assays as described in the 'Materials and Methods' section using a fluorimetric NAD+/NADH assay kit; 20, 10, and 5% BW loss groups versus tamoxifen-treated control (cntl) group, respectively (Bar=mean±S.D., each group n=5; *P<0.05, **P<0.01). BW, body weight. (c) Mouse jejunum tissue NAD levels. Mouse jejunum tissues (30 mg) were homogenized and the supernatants were taken for NAD+/NADH assays as described in the 'Materials and Methods' section using a fluorimetric NAD+/NADH assay kit; 20, 10, and 5% BW loss groups versus Tamoxifen-treated control (cntl) group, respectively (Bar=mean±S.D., each group n=5; *P<0.05, **P<0.01). BW, body weight. (d) Liver Sirt and Foxo gene expression in both Nampt−/− versus Nampt+/+ mice. RNA-seq was carried out as described in the 'Materials and Methods' section. Gene expression levels are expressed as mean±S.D. of FPKM in each group. (e) Top 10 function enrichment for 4638 significantly changed genes in Nampt−/− versus Nampt+/+ mice. (f) Schema of possible dying causes in Nampt−/− mice. The explanation is provided in the 'Discussion' section

