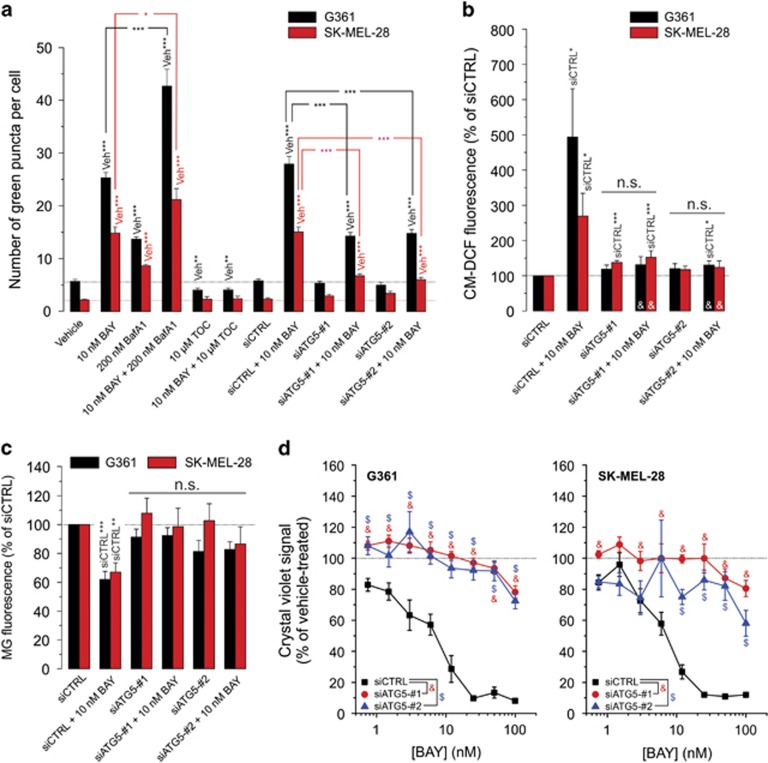
Figure 3.
Effect of ATG5 knockdown on the BAY-induced stimulation of autophagy, reactive oxygen species (ROS) increase and reduction in cell viability. (a) Effect of BAY in the absence and presence of BafA1, TOC and ATG5 knockdown on the number of green puncta in G361 and SK-MEL-28 cells (at 24 h; N=3, n=30). (b) Effect of BAY on ROS levels (at 24 h; N=3, n=9) in cells transfected with an empty or GPX4 overexpression vector (GPX-OE). (c) Effect of BAY on cellular MG fluorescence (G361: at 24 h; SK-MEL-28: at 24 h; N=3, n=9) in cells transfected with siCTRL, siATG5-no. 1 and siATG5-no. 2. (d) Effect of BAY on the viability of cells (G361: at 48 h; SK-MEL-28: at 72 h; N=3, n=6) transfected with siCTRL, siATG5-no. 1 and siATG5-no. 2. Statistics: Significant differences relative to the marked conditions are indicated by *P<0.05, **P<0.01 and ***P<0.001. NS indicates nonsignificant. In panel (d), significant differences with the (siCTRL+10 nM BAY condition) are marked by ‘&'. In panel (b) significant differences (P<0.05) between conditions are marked by symbols (&, $)

