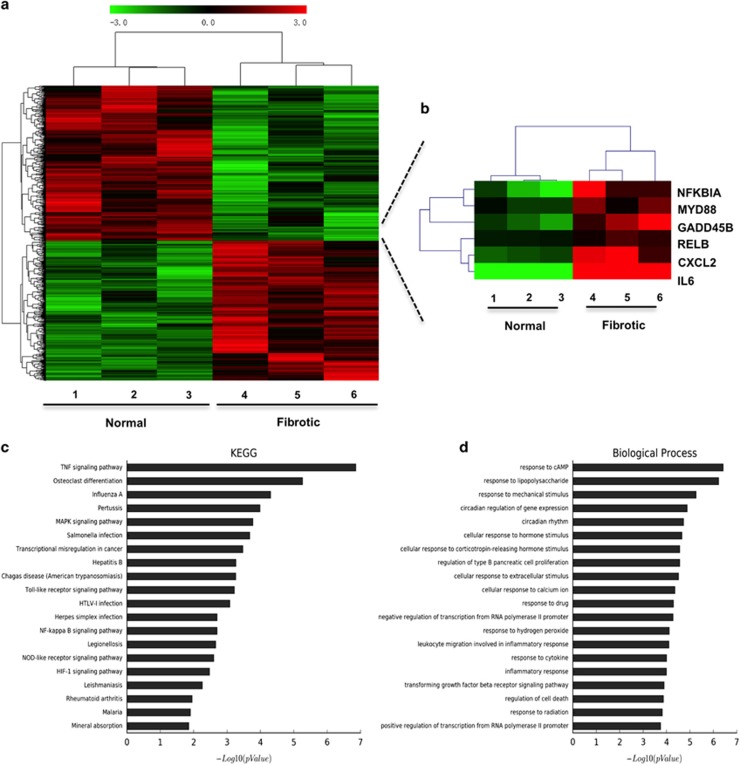
Figure 1.
Gene expression profile of tendon fibrotic tissues. (a) results of gene chip microarray in normal and fibrotic samples from patients. (b) Heat map depicting the gene expression profiles of NF-κB pathway in normal and fibrotic samples. Red, high expression; black, intermediate expression; green, lower expression. (c) The top 20 canonical pathways enriched in the upregulated genes by KEGG pathway analysis. (d) The top 20 biological process enriched in the upregulated genes by GO analysis of upregulated genes

