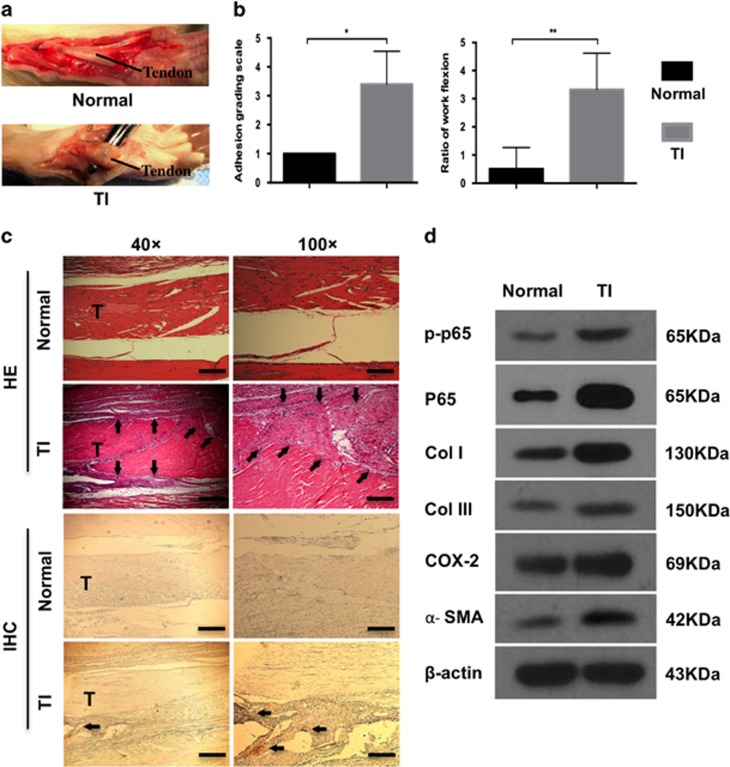
Figure 3.
The increased p65 expression in rat tendon adhesion. (a) Macroscopic images of tendons in normal and TI groups. (b) The adhesion grading score and ratio of work flexion for adhesion evaluation. The data are shown as the means±S.D. Statistical significance was calculated using paired Student t-test for five independent samples. *P<0.05. **P<0.01. (c) Histology of adhesion and immunohistochemistry of p65. T, tendon. Arrows indicate tendon adhesion in HE and p65 overexpression in IHC. × 40, bars indicates 500 μm. × 100, bars indicates 200 μm. (d) Western blot analysis of the levels of p-p65, p65, Col I, Col III, COX-2 and α-SMA expression

