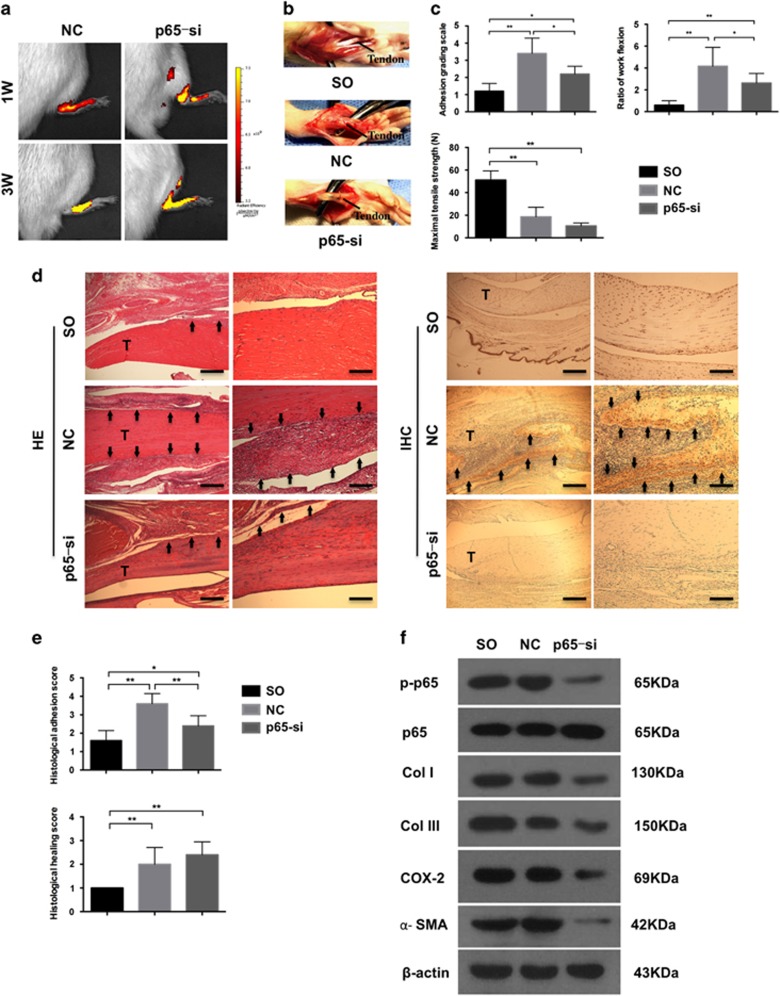
Figure 4.
P65 knockdown by siRNA in rat tendon adhesion. (a) Fluorescent images showing the location and activity of siRNA. (b) Macroscopic images showing adhesion in SO group, NC group, and p65-siRNA group (p65-si). (c) The adhesion grading score, ratio of work flexion and maximal tensile strength. The data are shown as the means±S.D. Statistical significance was calculated using one-way ANOVA for five independent samples. *P<0.05. **P<0.01. (d) Histology of adhesion and immunohistochemistry of p65. T, tendon. Arrows indicate tendon adhesion in HE and p65 overexpression in IHC. × 40, bars indicates 500 μm. × 100, bars indicates 200 μm. (e) Histological adhesion score and histological healing score. The data are shown as the means±S.D. Statistical significance was calculated using one-way ANOVA for five independent samples. (f) Western blot analysis of the levels of p-p65, p65, Col I, Col III, COX-2 and α-SMA expression

