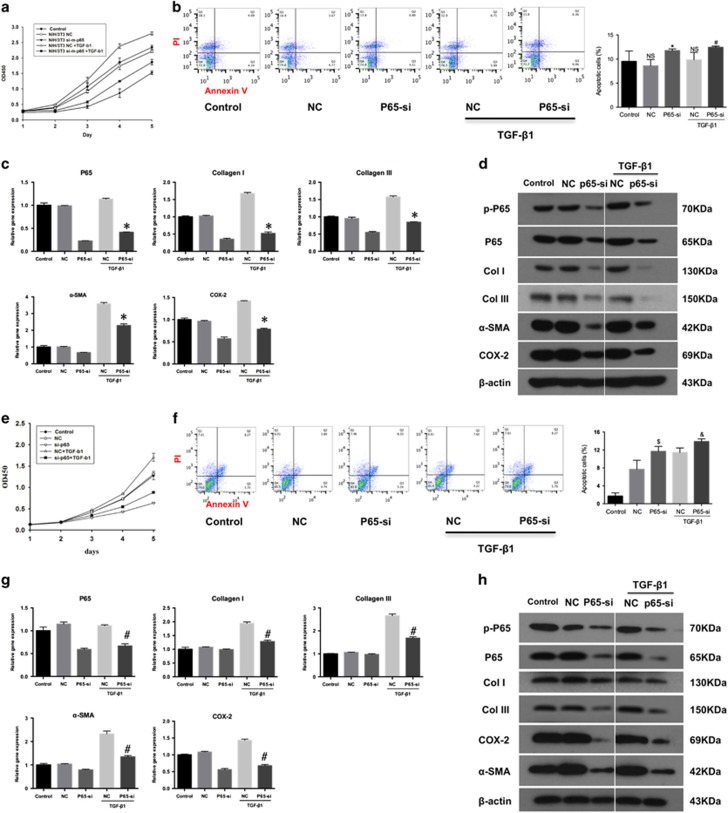
Figure 5.
P65 inhibition by siRNA influences cell proliferation, apoptosis, and inflammation in vitro. (a) Fbs proliferation. (b) The apoptosis of Fbs by flow cytometry. The data are shown as the means±S.D. Statistical significance was calculated by one-way ANOVA for five independent samples. NS, no significance compared control group. *P<0.05 compared with NC group, #P<0.05 compared with NC+TGF-β1 group. (c) The RT-PCR analysis of the mRNA levels of p65, Col I, Col III, COX-2 and α-SMA expression in Fbs. The data are shown as the means±S.D. Statistical significance was calculated by one-way ANOVA for five independent samples. *P<0.05 compared with NC+TGF-β1 group. (d) Western blot analysis of the protein levels of p-p65, p65, Col I, Col III, COX-2 and α-SMA expression in Fbs. (e) Tcs cells (Tcs) proliferation. (f) The apoptosis of Fbs by flow cytometry. The data are shown as the means±S.D. Statistical significance was calculated using one-way ANOVA for five independent samples. $P<0.01 compared with NC group, &P<0.05 compared with NC+TGF-β1 group. (g) The RT-PCR analysis of the mRNA levels of p65, Col I, Col III, COX-2 and α-SMA expression in Tcs. The data are shown as the means±S.D. Statistical significance was calculated by one-way ANOVA for five independent samples. #P<0.05 compared with NC+TGF-β1 group. (h) Western blot analysis of the levels of p-p65, p65, Col I, Col III, COX-2 and α-SMA expression in Tcs

