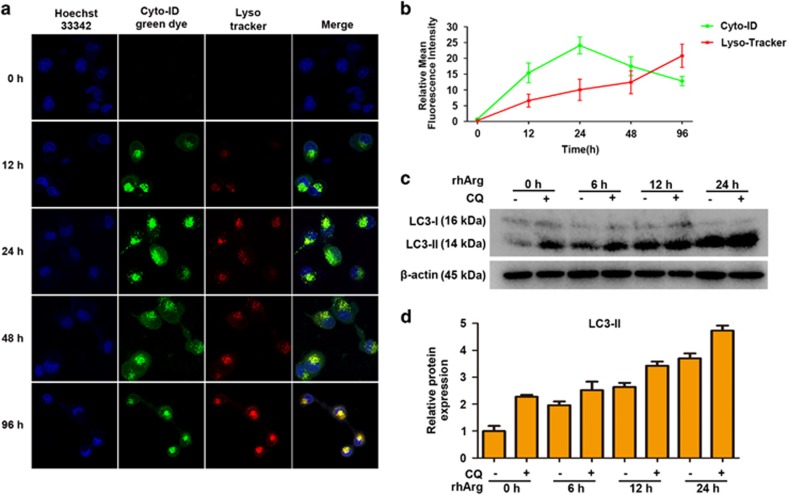
Figure 4.
Autophagic flux was detected in H1975 cells after rhArg treatment. (a,b) H1975 cells were stained with Cyto-ID and LysoTracker Red after exposed to 2 U/ml of rhArg for the indicated times. Confocal micrographs were taken at × 40. Green (Cyto-ID) and red (LysoTracker Red) dots in cells were counted by the ImageJ software (n=3, means±S.D.). (c,d) H1975 cells were treated with 2 U/ml of rhArg for different time in the presence or absence of 20 μM CQ. Cell lysates were analyzed by immunoblot analysis. Densitometric values were quantified using the ImageJ software and normalized to control. The values of control were set to 1. The data are presented as means±S.D. of three independent experiments

