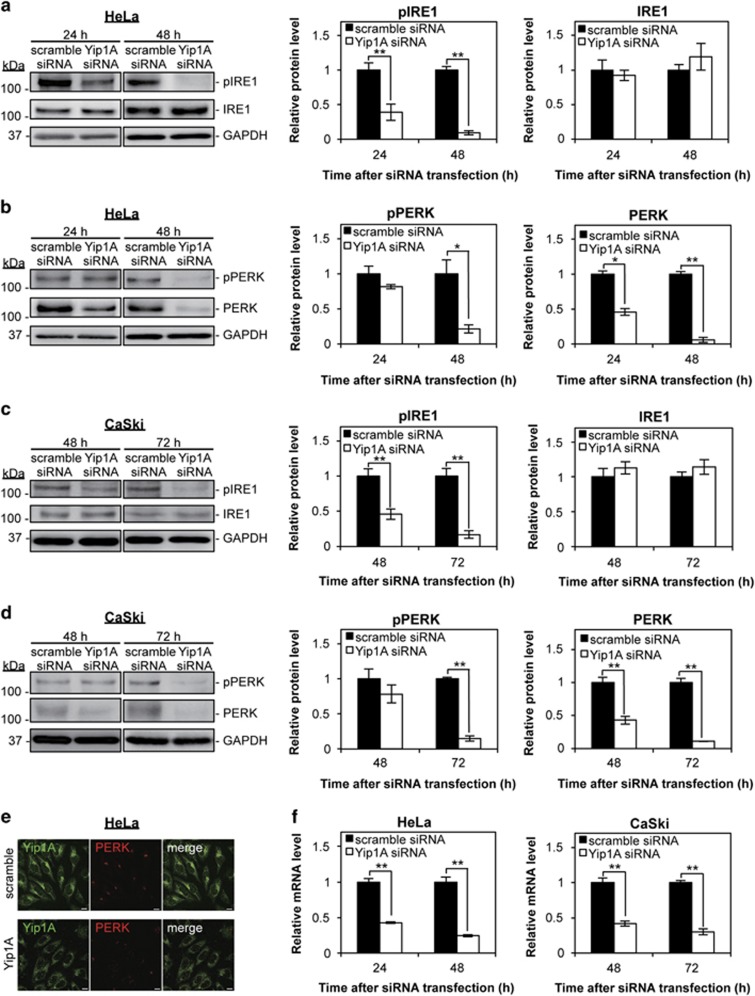
Figure 2.
Depletion of Yip1A inhibits the activation of IRE1 and PERK. (a) HeLa cells were treated with control scramble siRNA or Yip1A siRNA and cell lysates were prepared at the indicated time points. Western blotting shows the relative levels of phosphorylated IRE1 (pIRE1) and IRE1 protein in control and Yip1A-knockdown cells at 24 h and 48 h after siRNA transfection. GAPDH was used for normalization. Data are means±S.D. from three independent experiments; **P<0.01. (b) Western blotting shows relative levels of phosphorylated PERK (pPERK) and PERK protein in control and Yip1A-knockdown cells at 24 h and 48 h after siRNA transfection. GAPDH was used for normalization. Data are means±S.D. from three independent experiments; *P<0.05, **P<0.01. (c) CaSki cells were treated with control scramble siRNA or Yip1A siRNA and the cell lysates were prepared at the indicated time points. Western blotting shows the relative levels of pIRE1 and IRE1 protein in control and Yip1A-knockdown cells at 48 h and 72 h after siRNA transfection. GAPDH was used for normalization. Data are means±S.D. from three independent experiments; **P<0.01. (d) Western blotting shows relative levels of pPERK and PERK protein in control and Yip1A-knockdown cells at 48 h and 72 h after siRNA transfection. GAPDH was used for normalization. Data are means±S.D. from three independent experiments; **P<0.01. (e) Representative confocal micrographs of control (upper panels) and Yip1A-knockdown (lower panels) HeLa cells at 24 h after siRNA transfection, showing the depletion of PERK by Yip1A knockdown. Fixed cells were double-stained for Yip1A (green) and PERK (red). Scale bars are 10 μm. (f) RT-PCR shows relative levels of PERK mRNA in control and Yip1A-knockdown cells. GAPDH was used for normalization. Data are means±S.D. from three independent experiments. **P<0.01

