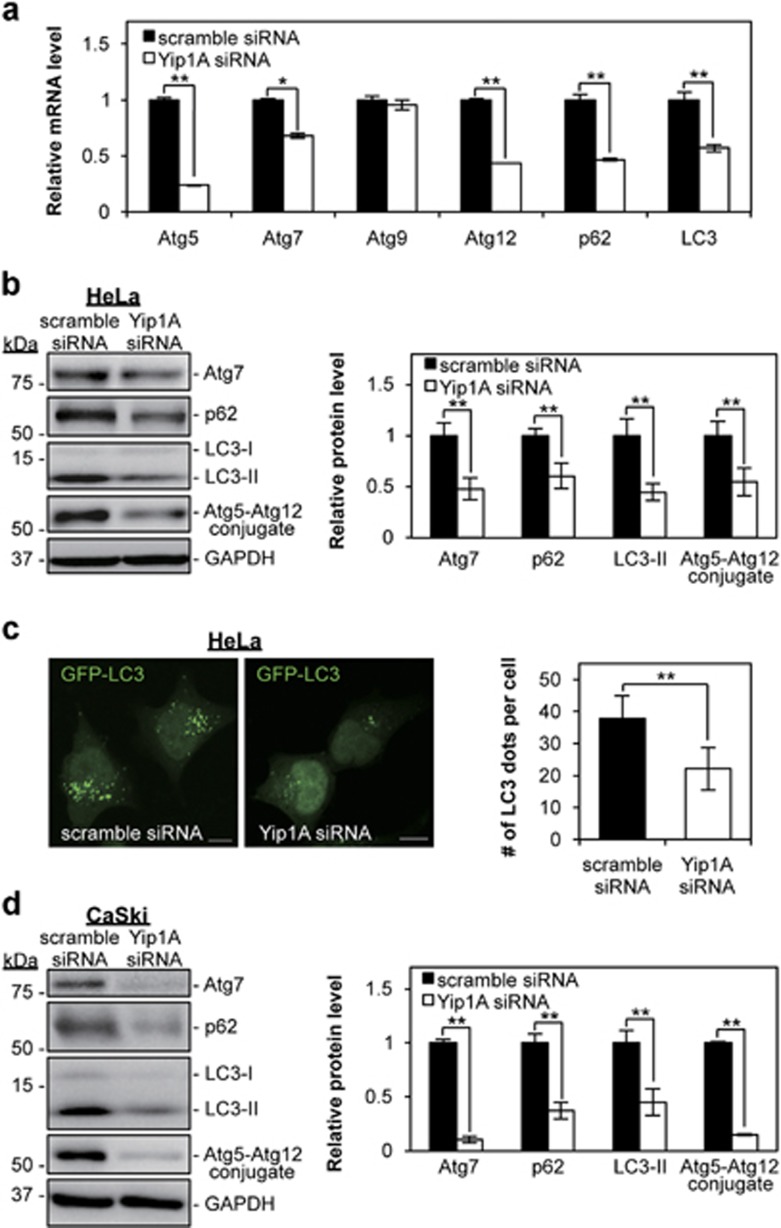
Figure 5.
Depletion of Yip1A suppresses autophagy. (a) HeLa cells were transfected with control scramble siRNA or Yip1A siRNA. RT-PCR shows the relative mRNA levels of the indicated autophagy-related factors in the control and Yip1A-knockdown cells at 48 h after siRNA transfection. GAPDH was used for normalization. Data are means±S.D. from three independent experiments; *P<0.05, **P<0.01. (b) Western blotting shows the relative levels of Atg7, p62, and LC3-II protein, and Atg5–Atg12 conjugate in the control and Yip1A-knockdown cells at 48 h after siRNA transfection. GAPDH was used for normalization. Data are means±S.D. from three independent experiments; **P<0.01. (c) HeLa cells were co-transfected with either control scramble siRNA or Yip1A siRNA and pEGFP-LC3 expression plasmid DNA. After 48 h, autophagosome formation was measured by visualizing LC3-positive dots with the use of a confocal microscope. Scale bars are 10 μm. Quantification of the number of LC3-positive dots per cell is shown in the bar graph (n=30 cells); **P<0.01. (d) CaSki cells were transfected with control scramble siRNA or Yip1A siRNA. Western blotting shows the relative levels of Atg7, p62, and LC3-II protein, and Atg5–Atg12 conjugate in the control and Yip1A-knockdown cells at 72 h after siRNA transfection. GAPDH was used for normalization. Data are means±S.D. from three independent experiments; **P<0.01

