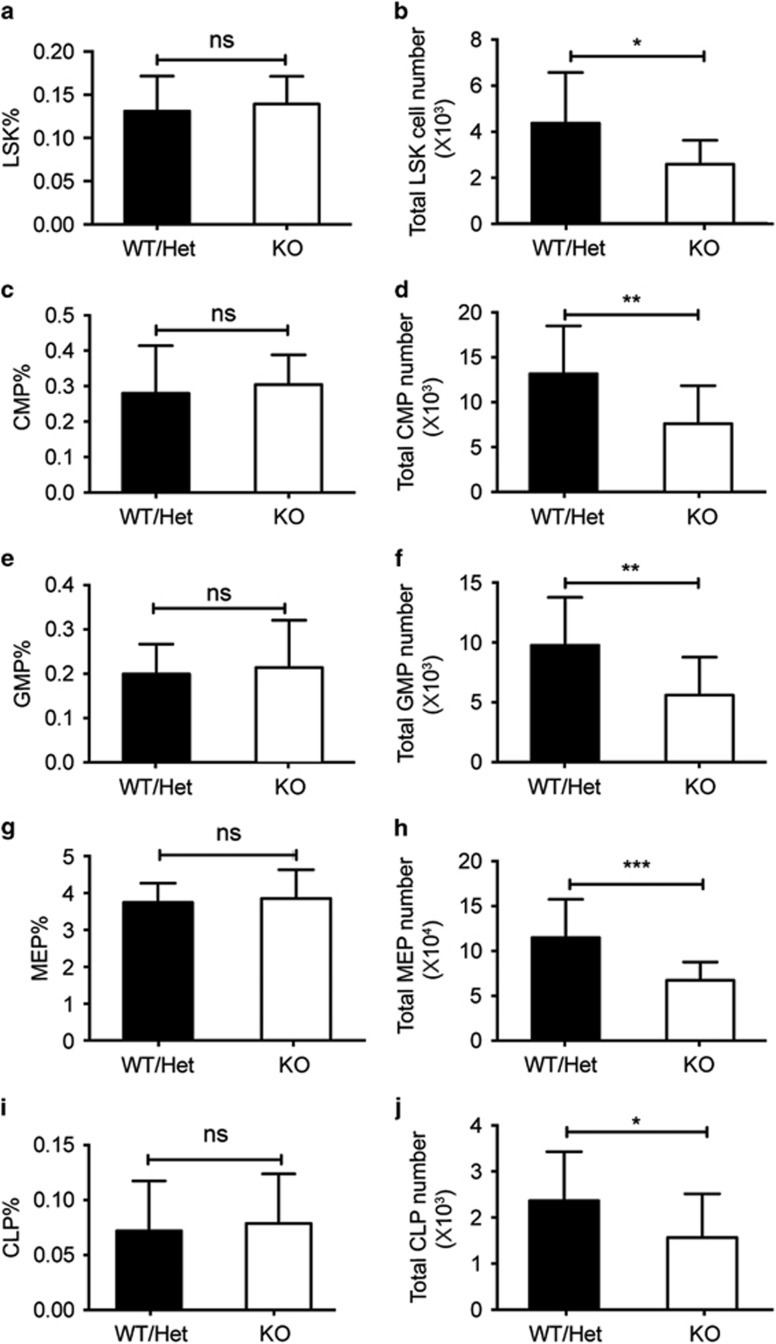
Figure 3.
Numbers of HSPCs are reduced in Stk40−/− fetal livers. (a and b) Frequencies and absolute numbers of LSK cells of each E14.5 Stk40 WT/Het and KO fetal liver. (c and d) Frequencies and absolute numbers of common myeloid progenitor of each E14.5 Stk40 WT/Het and KO fetal liver. (e and f) Frequencies and absolute numbers of granulocyte–monocyte progenitor of each E14.5 Stk40 WT/Het and KO fetal liver. (g and h) Frequencies and absolute numbers of MEP of each E14.5 Stk40 WT/Het and KO fetal liver. (i and j) Frequencies and absolute numbers of common lymphoid progenitor of each E14.5 Stk40 WT/Het and KO fetal liver. For panels (a–j), WT/Het, n=27; KO, n=18. *P≤0.05, **P≤0.01, ***P≤0.001; ns, no significance

