Figure 4.
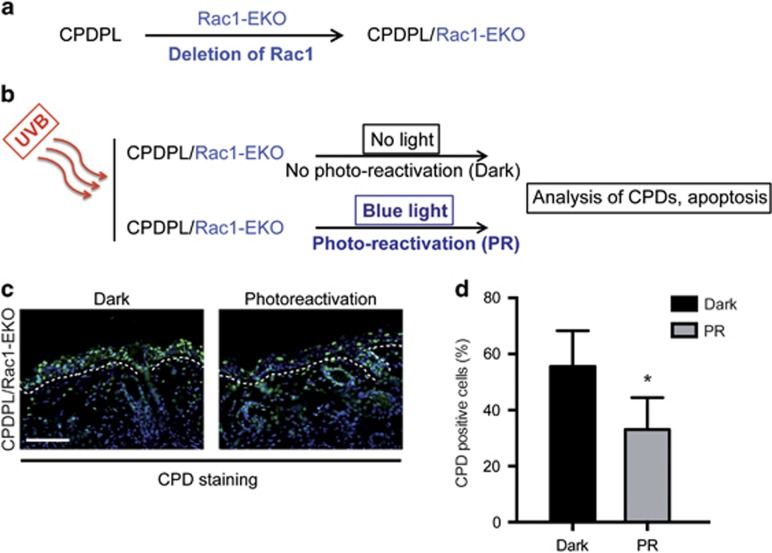
Generation of CPDPL/Rac1-EKO mice and photoreactivation of CPDPL in CPDPL/Rac1-EKO mice. (a and b) Schematic representation of generation of CPDPL/Rac1-EKO mice and the photoreactivation experiments, respectively. (c) Immunostainings against CPD (green) of UV-irradiated skin of CPDPL/Rac1-EKO mice kept in the dark and under the photoreactivation lamp. Nuclei are stained in blue. Dashed line demarcates border between epidermis and dermis. Scale bar=100 μm. (d) Graph shows quantification of CPD-positive cells from UV-irradiated CPDPL/Rac1-EKO mice kept in the dark and under the photoreactivation (PR) lamp (n=5 each). Error bars show S.D. Asterisk show P-value<0.05

