Figure 6.
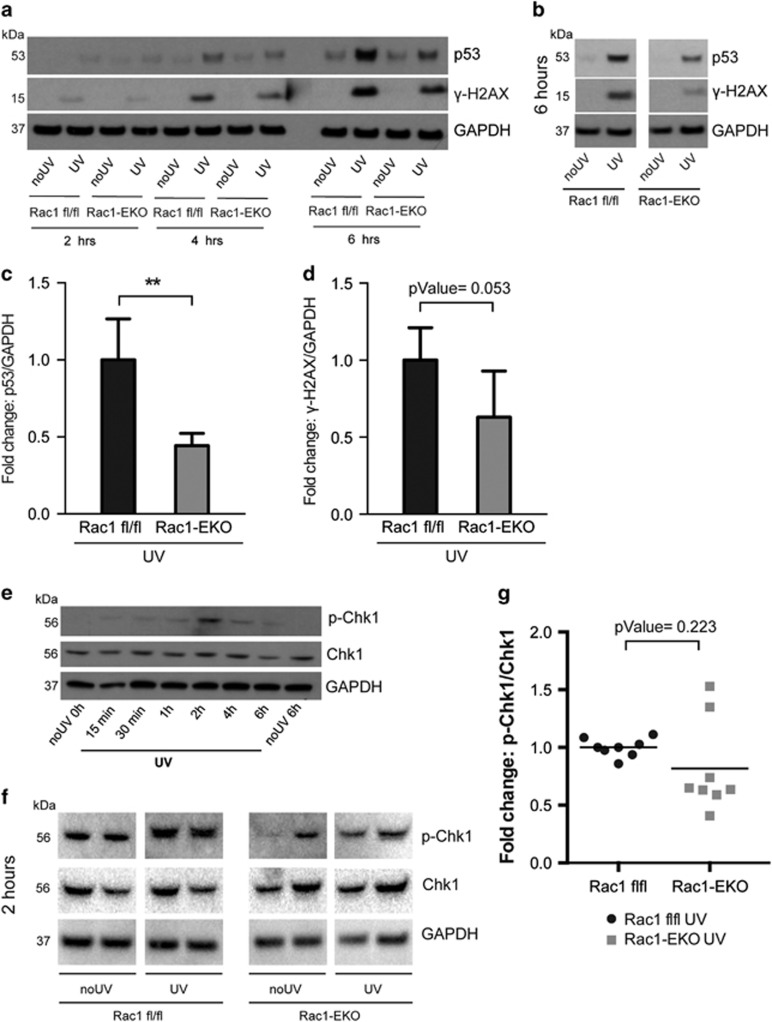
Rac1-deficient keratinocytes show an altered DNA damage response upon UV-irradiation. (a) Western blot analysis of p53 and phosphorylation of H2AX (γ-H2AX) from Rac1 fl/fl and Rac1-EKO keratinocytes at indicated time points with (UV) or without (no UV) UV-irradiation. Time-course experiments revealed highest levels of p53 and γ-H2AX at 6 h after UV-irradiation in Rac1 fl/fl keratinocytes as compared with non-irradiated controls. Therefore, we used the 6 h time point for further analysis of p53 protein levels and γ-H2AX. (b) Representative western blot analysis of p53 and γ-H2AX from Rac1 fl/fl and Rac1-EKO cultured keratinocytes at 6 h with (UV) or without (no UV) UV-irradiation. (c and d) Densitometry analyses of fold change of p53 (n=3 each) (c) and γ-H2AX (n=5 each) (d) normalized to GAPDH in Rac1 fl/fl and Rac1-EKO samples at 6 h after UV-irradiation. Error bars show S.D. ***represent P-value<0.001. (e) Western blot analysis of p-Chk1 and Chk1 from Rac1 fl/fl keratinocytes at indicated time points after UV-irradiation. Time-course experiments revealed maximum phosphorylation of Chk1 at 2 h after UV-irradiation in Rac1 fl/fl primary keratinocytes. Therefore, in the following experiments, phosphorylation of Chk1 was investigated at 2 h after UV-irradiation. (f) Representative western blots of p-Chk1, Chk1 from Rac1 fl/fl and Rac1-EKO cultured keratinocytes at 2 h with (UV) or without (no UV) UV-irradiation. GAPDH was used as loading control. Numbers on the left denote molecular weights in kDa. (g) Dot plot showing densitometry analysis results of fold change of p-Chk1 normalized to total Chk1 in Rac1 fl/fl and Rac1-EKO samples after UV-irradiation

