Figure 1.
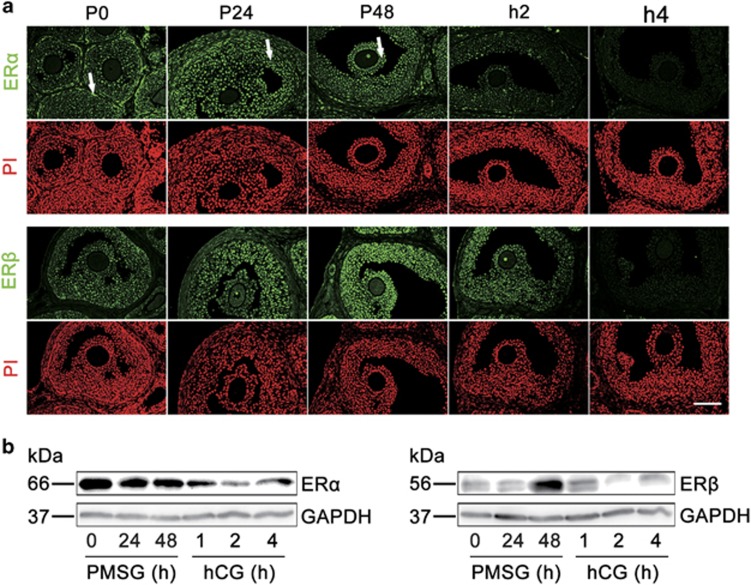
Gonadotropins control ER levels in mouse ovaries in vivo. (a) Immunofluorescence analysis of ERα and ERβ expression in ovaries. Ovaries were stained for ERα or ERβ (green) and the nuclear marker propidium iodide (PI, red) at the indicated time points after PMSG stimulation followed at 48 h later with hCG. ERα protein was highly expressed in theca cells (indicated by arrows in P0) in small follicles, but also stained in MGCs (indicated by arrows in P24) and CCs (indicated by arrows in P48) of large antral follicles by PMSG stimulation. ERβ staining was predominantly observed in MGCs and CCs in large antral follicles. P, means PMSG, h means hCG. Scale bars: 100 μm. (b) WB data indicating the regulation of gonadotropins on ERα and ERβ levels in ovaries. Ovaries were isolated from 22- to 24-day-old mice stimulated with PMSG followed at 48 h later with hCG as indicated in figures. GAPDH served as a loading control

