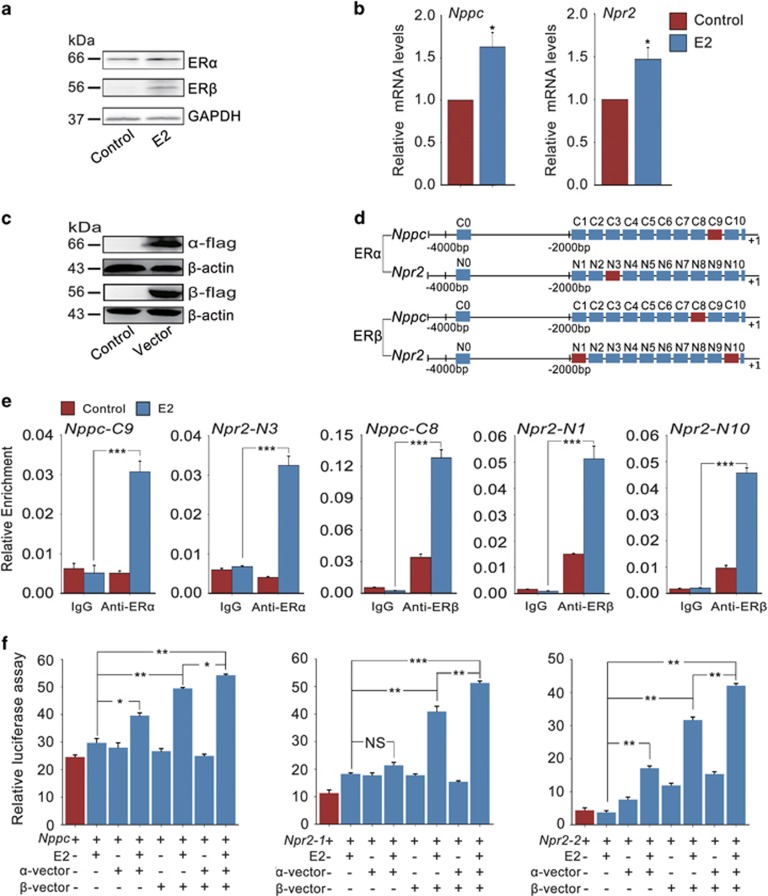
Figure 4.
ERs directly regulate Nppc and Npr2 gene transcription. (a) Expression of ERα and ERβ proteins in KK1 cells in response to E2 stimulation. KK1 cells were treated without (control) or with 0.1 μM E2 for 24 h. GAPDH served as a loading control. (b) Effect of E2 on Nppc and Npr2 levels in KK1 cells. KK1 cells were cultured for 24 h in medium containing 0.1 μM E2 or not (control). n=3. (c) Expression of ERα and ERβ proteins in KK1 cells after transfection with empty vector (control), flag-tagged mouse α-vector or β-vector for 48 h. ERα and ERβ protein levels were assessed using an anti-flag antibody. β-Actin served as a loading control. (d) Schematic diagram of Nppc and Npr2 genome structure. Each rectangle denotes 200 bp. Red rectangles represent the Nppc or Npr2 promoter binding sequences for ERα or ERβ. (e) ChIP-qPCR analysis of the interaction between ERα/ERβ proteins and Nppc/Npr2 promoters in KK1 cells. KK1 cells (transfection with empty vector, flag-tagged mouse α-vector or β-vector) were treated without (control) or with 0.1 μM E2 for 6 h. n=3. (f) The binding of ERα/ERβ to Nppc/Npr2 promoter regions detected by luciferase reporter assay. KK1 cells (transfection with pRL-TK plus flag-tagged mouse α-vector, β-vector or both) were treated without or with 0.1 μM E2 for 24 h. pRL-TK, an internal control plasmid to normalize firefly luciferase activity of the reporter plasmids. Nppc, Npp2-1 or Npr2-2 represent pGL3-basic plasmid containing −2000 to 1 regions of the Nppc gene, −616 to 1 or −2000 to −1260 regions of the Npr2 gene, respectively. n=4. Data represent the mean±S.E.M. *P<0.05, **P<0.01 and ***P<0.001 (t-test)

