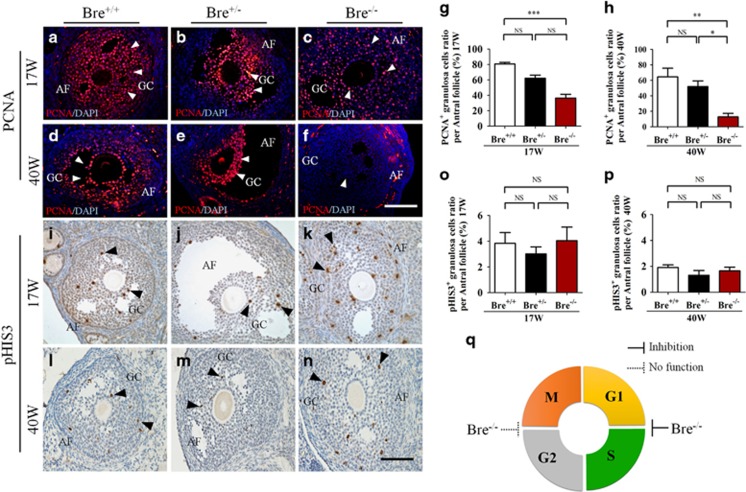
Figure 4.
Ovarian sections immunofluorescently stained for PCNA and pHIS3. Representative micrographs of developing follicles stained for PCNA (a–f) and pHIS3 (i–n) to demonstrate the extent of granulosa cell proliferation in the follicles. (g and h) Bar charts comparing the average number of PCNA+ granulosa cells in antral follicles of 17- (g) and 40- (h) week-old BRE+/+, BRE+/− and BRE−/− ovaries. (o and p) Bar charts comparing the average number of pHIS3+ granulosa cells in antral follicles. (q) Pie chart predicting where BRE targets the cell cycle during granulosa cell proliferation (as predicted from the BRE−/− results). AF, antral follicle; GC, granulosa cells. Scale bar=100 μm in a–n

