Figure 6.
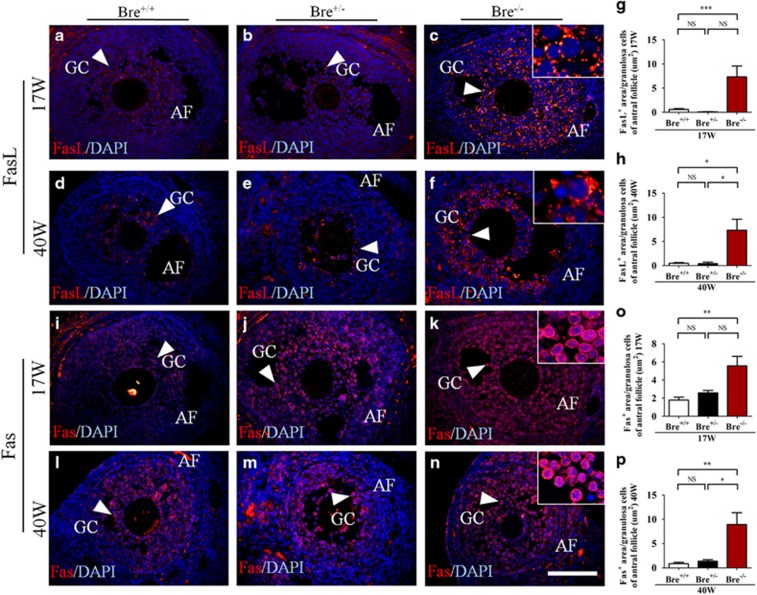
Ovarian sections stained for FasL and Fas expression. Representative micrographs of antral follicles immunofluorescently stained for FasL (a–f) and Fas (i–n) expression in 17- and 40-week-old BRE+/+, BRE+/− and BRE−/− ovaries. Higher-magnification images are highlighted at top right corners of c, f, k and n. (g and h) Bar charts showing areas that are FasL+ over the total granulosa cell area of antral follicles, in 17- (G) and or 40- (h) week-old BRE+/+, BRE+/− and BRE−/− ovaries. (o and p) Bar charts showing areas that are Fas+ over the total granulosa cell area of antral follicles, in 17- (o) and or 40- (p) week-old BRE+/+, BRE+/− and BRE−/− ovaries. AF, antral follicle; GC, granulosa cells. Scale bar=100 μm in a–n

