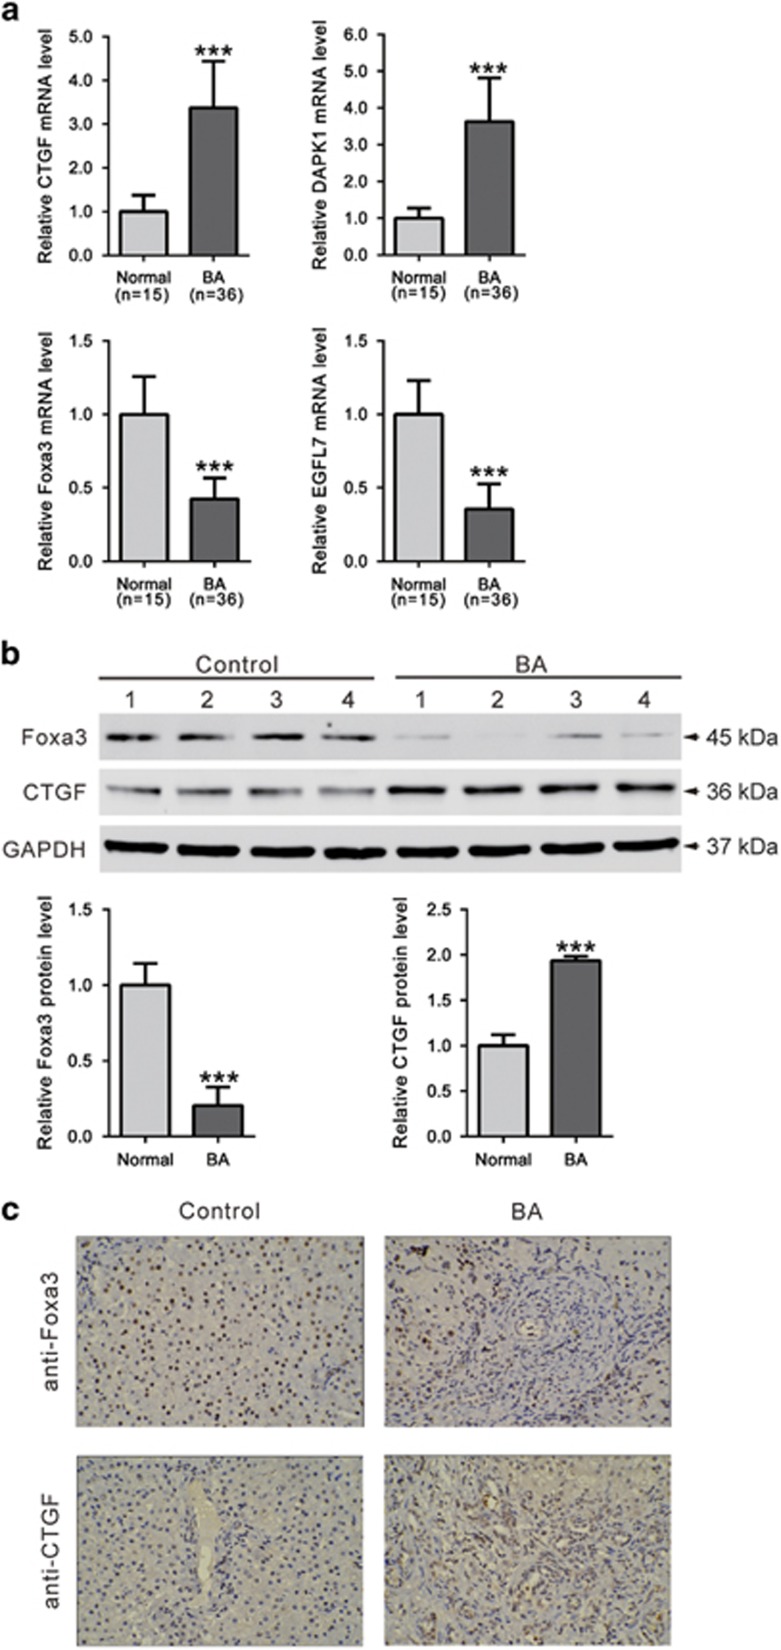
Figure 2.
Validation of RNA-seq data. (a) mRNA levels of CTGF, DAPK1, Foxa3 and EGFL7 were evaluated by qRT-PCR. Data represent mean values±S.D. from three independent experiments. Protein levels of Foxa3 and CTGF in livers of biliary atresia patients and control were assessed by western blotting (b) and immunohistochemistry staining (c) (***P<0.001 versus control)

