. 2017 Mar 17;6:e25257. doi: 10.7554/eLife.25257

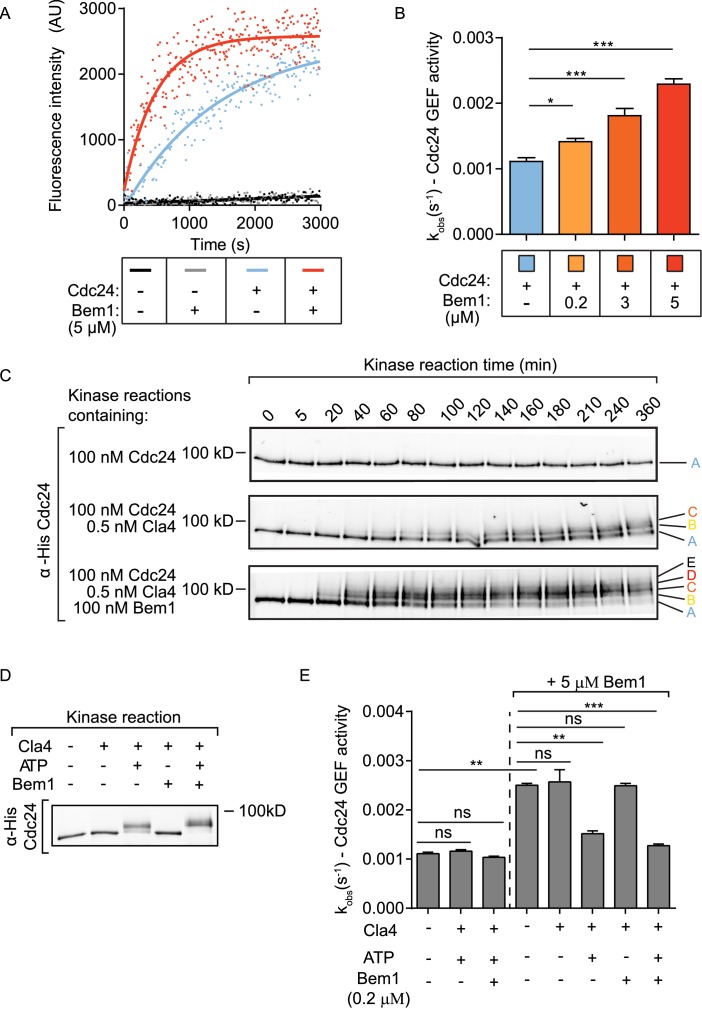
Figure 1. The scaffold Bem1 directly stimulates Cdc24 GEF activity in a reversible manner via PAK-dependent phosphorylation.

(A) Fluorescence intensity change associated with the nucleotide exchange of GDP-Cdc42 for mant-GTP Cdc42. Fluorescence was measured after the addition of GDP-Cdc42 (9 µM) to reactions containing Mant-GTP (100 nM) and GMP-PNP (100 µM) in the absence (blue curve) and presence (red curve) of Bem1 (5 µM) and Cdc24 (60 nM). (B) Observed kinetic rate constants were obtained by fitting trace data to a single exponential equation. Error bars show SD and confidence where *p<0.05 and ***p<0.001. (C) In vitro kinase reactions in which the indicated proteins were incubated with Cdc24-6xHis. At the times indicated, samples were removed and analysed by SDS-PAGE and Western blotting using anti-His antibody to detect the electrophoretic mobility shift of Cdc24-6xHis. (D) A Western blot showing the phosphorylation of Cdc24 in the samples used for subsequent GEF assays. (E) The observed kinetic rate constants of Cdc24 GEF activity obtained by fitting trace data to a single exponential equation. The reactions indicated on the right had additional Bem1 added to 5 µM.

DOI: http://dx.doi.org/10.7554/eLife.25257.002

Figure 1—source data 1. Excel file showing the observed rate constants for the GEF assays presented in Figure 1B and E.
DOI: 10.7554/eLife.25257.003

Figure 1.

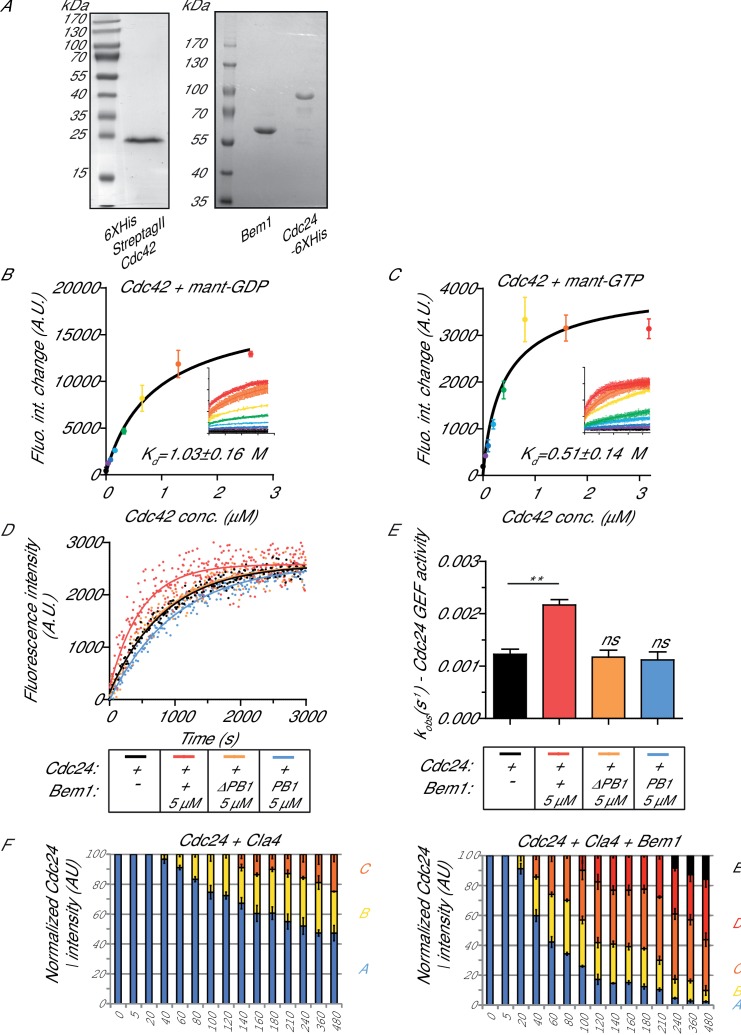
Figure 1—figure supplement 1. The interaction of Cdc42 with mant- nucleotides and the dependence of scaffold stimulation on the PB1 domain.

Figure 1—figure supplement 1.

(A) Coomassie-stained SDS-PAGE of purified Cdc42, Cdc24 and Bem1. (B) Estimation of the Kd of mant-GDP for nucleotide-free Cdc42. (C) Estimation of the Kd of mant-GTP for nucleotide-free Cdc42. (D) Nucleotide exchange rates for Cdc24 in the presence (orange curve) or absence (black curve) of a bem1 △PB1 mutant or in the presence of the Bem1 PB1 domain (blue curve). Assay conditions as in Figure 1A were used. (E) Observed kinetic rate constants for the reactions shown in (D) were obtained by fitting trace data to a single exponential equation. Error bars show SD and confidence where **p≤0.01. (F) Densitometry analysis of the resolved phosphorylated forms of Cdc24 shown on the blots in Figure 1C.
Figure 1—figure supplement 1—source data 1. Excel file showing the observed rate constants for the GEF assays presented in Figure 1—figure supplement 1E.
DOI: 10.7554/eLife.25257.005