. 2017 Feb 24;6:e20147. doi: 10.7554/eLife.20147

Figure 3. Behavioral pre-training reveals enhanced learning in mice with enhanced LTD.

(A) The same VOR-increase training procedure induced dramatically different learning outcomes in the DKO mice with different pre-training procedures (p=0.01, F = 5.153, ANOVA). Left, Without pre-training, DKO mice with enhanced pf-Pk LTD were impaired on VOR-increase learning (**p=0.002, F(1,38) = 11.08, two-factor repeated measures ANOVA; WT n = 16,. DKO n = 24,). Middle, Pre-training with an associative VOR-decrease paradigm that was not significantly different between the genotypes (dotted lines, p=0.19, F(1,29) = 1.79; WT n = 12, DKO n = 19) reversed the learning impairment in DKO mice (red) so that they learned more than WT (black) during subsequent VOR-increase training (*p=0.02, F(1,29) = 5.95; WT n = 12, DKO n = 19). Right, Pre-training with a vestibular stimulus alone decreased the VOR gain comparably between the two genotypes (dotted line, p=0.30, F(1,17) = 1.25; WT n = 6, DKO n = 7), but there was no improvement of subsequent VOR-increase learning in the DKO mice relative to WT mice (p=0.13, F(1,11) = 2.70; WT n = 6, DKO n = 7). In DKO mice, VOR-increase learning was better after associative VOR-decrease pre-training compared with no pre-training (**p=0.005, Fischer’s LSD) or vestibular-only pre-training (*p=0.03) (compare red bar graphs and learning curves). In contrast, in WT mice, VOR-increase learning was worse after associative VOR-decrease pre-training compared with no pre-training (*p=0.037, Fischer’s LSD) or vestibular only pre-training (*p=0.049) (compare black learning curves). Learning is plotted on the same scale in each plot, and aligned on the values at the start of VOR-increase training for DKO mice. Mean ± s.e.m. (B) Virally-mediated rescue of H2-Db expression in floccular Purkinje cells (L7::H2-Db, left) eliminated the enhanced VOR-increase learning in DKO mice after associative VOR-decrease pre-training (compare with middle panel of A), so that learning was indistinguishable from WT mice injected with the same virus (VOR-increase learning, p=0.98, F(1,22) = 0.0004; VOR-decrease pre-training, p=0.53, F(1,22) = 0.40; two-factor repeated measure ANOVA; WT n = 9; DKO n = 15). The enhanced VOR-increase learning phenotype was present in DKO mice that received control virus expressing only GFP (L7::GFP, right, p=0.05, F(1,18) = 4.29; WT n = 9, DKO n = 11) although the VOR-decrease pre-training itself was not significantly different between the two genotypes (p=0.20, F(1,18) = 1.75; WT n = 9, DKO n = 11). Mean ± s.e.m.

DOI: http://dx.doi.org/10.7554/eLife.20147.012

Figure 3—source data 1. Behavioral pre-training reveals enhanced learning in mice with enhanced LTD.
The same VOR-increase training procedure induced dramatically different learning outcomes in the DKO mice with different pre-training procedures. Data show time course of VOR learning in WT and DKO mice during 30 min of different pre-training conditions (no pre-training, VOR-decrease pre-training, and vestibular only pre-training) followed by 30 min of normal VOR-increase training. Data are separated by pre-training condition and by whether mice received virus for rescue expression of H2-Db in Purkinje cells (without virus, with L7::H2-Db virus, or control L7::GFP virus). Learning was calculated as the percentage change in the VOR gain after each block of 10 min training relative the baseline VOR gain measured before any training occurred. Negative values indicate decrease VOR learning and positive values indicate increase VOR learning. However, in this case with pre-training, a reduction in negative values also indicates increase VOR learning. Each row of numbers within the condition columns corresponds to the time course of learning in an individual animal.
DOI: 10.7554/eLife.20147.013

Figure 3.

Figure 3—figure supplement 1. Control for efficacy of VOR-decrease pre-training.

Figure 3—figure supplement 1.

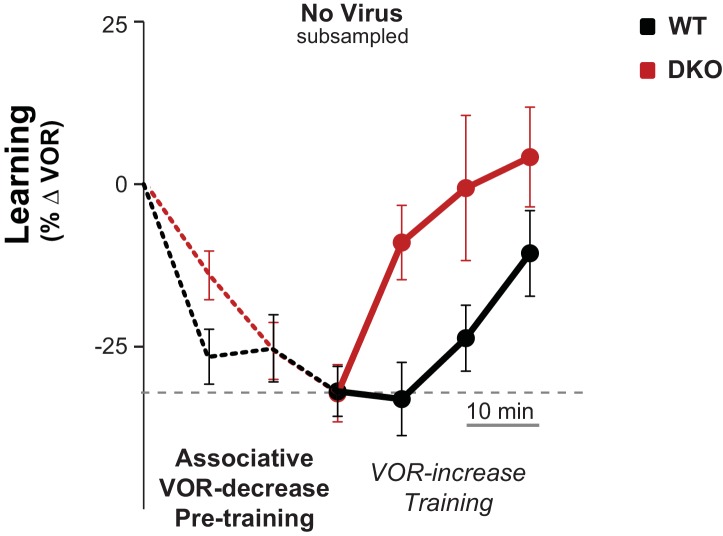
Subsampling was performed on the data from Figure 3A, middle to test whether the enhanced learning phenotype in DKO mice could result from the trend (n.s., p=0.19, F(1,29) = 1.79; WT n = 12, DKO n = 19) for the DKO mice to undergo a smaller mean decrease in VOR gain during the VOR-decrease pre-training. Data from Figure 3A were subsampled by alternately dropping data from the DKO mice with the smallest decrease in VOR gain during pre-training (as measured at the end of the 30 min of pre-training), and from WT mice with the largest decrease in VOR gain during pre-training, until the trend for the DKO mice to have a smaller mean decrease in VOR-gain during pre-training was eliminated. Even after controlling for the efficacy of the VOR-decrease pre-training, there was a trend for DKO mice (red) to learn more than WT (black) during subsequent VOR-increase training (p=0.07, F(1,26) = 3.68; WT n = 11, DKO n = 17). Mean ± s.e.m.
Figure 3—figure supplement 2. Normal retention of VOR-decrease learning in DKO mice.

Figure 3—figure supplement 2.

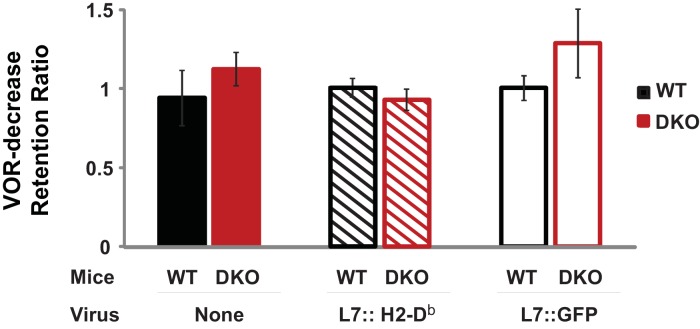
DKO mice showed normal induction and retention of VOR-decrease learning in response to the VOR-decrease training protocol that was used for behavioral pre-training in Figure 3. A retention ratio was calculated as the learned percentage change in the VOR (relative to the pre-training baseline) measured after a 10 min retention period, divided by the percentage change in the VOR measured immediately after training. A retention ratio of 1.0 would represent perfect retention of VOR-decrease learning and values less than 1.0 would represent forgetting during the 10 min retention period. DKO mice (solid red bars) exhibited no additional forgetting of VOR-decrease learning (p=0.31, t(5) = 1.11; DKO n = 4, WT n = 3) that could explain the enhanced VOR-increase learning that was observed during the same 10 min period after VOR-decrease training (Figure 3A, middle panel). The retention of VOR-decrease learning was also stable in animals injected either with virus to rescue H2-Db specifically in floccular Purkinje cells (L7::H2-Db, hatched bars, p=0.275, t(11) = 1.148, WT n = 5, DKO n = 8) or with control virus expressing only GFP (L7::GFP, open bars, p=0.99, t(11) = 0.013, WT n = 6, DKO n = 7) (Figure 1E). During the 10 min retention period, mice were restrained in the dark with their head stationary. Mean ± s.e.m.
Figure 3—figure supplement 3. No enhanced learning phenotype was observed in DKO mice when tested using lower visual-vestibular stimulus frequencies.

Figure 3—figure supplement 3.

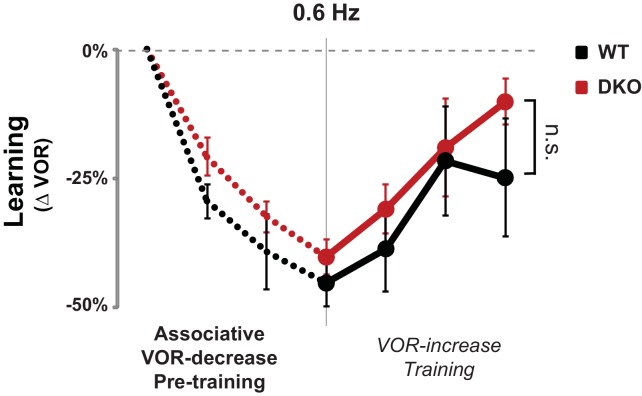
When testing and training were conducted using visual and vestibular stimuli at a frequency of 0.6 Hz, pre-training with the VOR-decrease paradigm (dotted lines) had no effect on subsequent VOR-increase learning in DKO mice (red) compared with WT mice (black) (ANOVA, p=0.10, F(1,84) = 2.761, WT n = 7, DKO n = 7), in contrast to the enhanced VOR-increase learning after pre-training that was observed when the training and testing were done at a stimulus frequency of 1 Hz (Figure 3A, middle panel). Mean ± s.e.m.