
Figure 1. Striatal PV Interneurons Unidirectionally Control Spontaneous MSN activity.
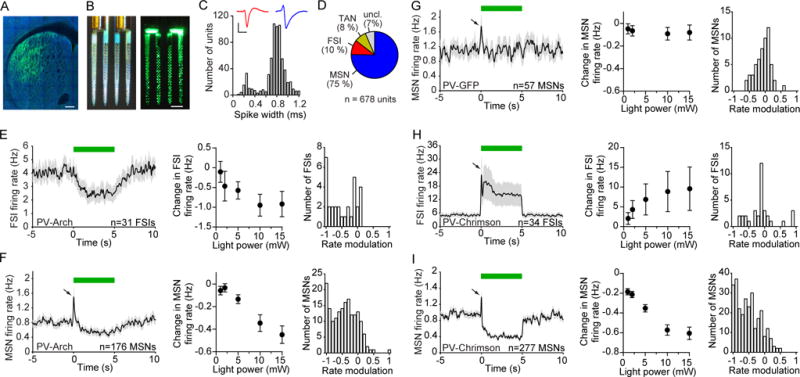
(A) Selective expression of Arch-GFP in PV cells in the dorsolateral striatum of PV-Cre mice. GFP (green) and NeuN (blue). Scale bar, 200 μm.
(B) Opto-microprobe device containing a 256 electrode silicon probe combined with 2 optical fibers. Left: view under ambient light. Right: view under laser illumination from the fibers. Scale bar, 200 μm.
(C) Distribution of trough-to-peak spike waveform duration of 678 striatal units recorded across 15 animals used in Figure 1. Narrow spiking units (less than 0.475 ms trough-to-peak duration) were mainly classified as putative FSIs, and wide spikes (greater than 0.55 ms trough-to-peak duration) were mainly classified as putative MSNs. Inset shows mean spike waveform of a representative FSI (red) and MSN (blue). Scale bars, 0.5 ms horizontal, 50 μV vertical.
(D) Percentage of putatively identified or unclassified striatal units.
(E) Response of 31 FSIs recorded in vivo to optical stimulation in Arch-expressing PV-Cre mice (PV-Arch). Left: The mean spontaneous firing rate was transiently reduced during 5 s continuous light delivery (green bar). Middle: The change in firing rate varied with optical fiber output power (one-way ANOVA, F4,120 = 4.3, p = 0.003). Right: Rate modulation index (RMI) distribution at 10 mW power. The median RMI was significantly different from zero (signed-rank test, p < 0.0001).
(F) Response of 176 MSNs to optical stimulation in PV-Arch mice. Left: After a brief excitatory response (black arrow) which was subsequently found to be an artifact, the mean activity decreased. Middle: The change in firing rate varied with optical fiber output power (one-way ANOVA, F4,700 = 14, p < 0.0001). Right: RMI distribution at 10 mW. The median RMI was significantly different from zero (signed-rank test, p < 0.0001).
(G) Response of 57 MSNs to optical stimulation in PV-GFP mice, which were not injected with optogenetic constructs. Left: There was no sustained change in firing relative to baseline. Middle: The change in firing rate did not significantly depend on optical fiber output power (one-way ANOVA, F4,224 = 0.1, p = 0.99). Right: RMI distribution at 10 mW. The median RMI was not significantly different from zero (signed-rank test, p = 0.77).
(H) Response of 34 FSIs to optical stimulation in PV-Chrimson mice. Left: There was an increase in mean firing relative to baseline. Middle: The change in firing rate varied with optical fiber output power (one-way ANOVA, F4,132 = 2.6, p = 0.04). Right: RMI distribution at 10 mW. The median RMI was not significantly different from zero (signed-rank test, p = 0.77).
(I) Response of 277 MSNs to optical stimulation in PV-Chrimson mice. Left: There was a decrease in mean firing relative to baseline. Middle: The change in firing rate varied with optical fiber output power (one-way ANOVA, F4,1104 = 33, p < 0.0001). Right: RMI distribution at 10 mW. The median RMI was significantly different from zero (signed-rank test, p < 0.0001). See also Figures S1, S2. Data represent mean ± SEM.