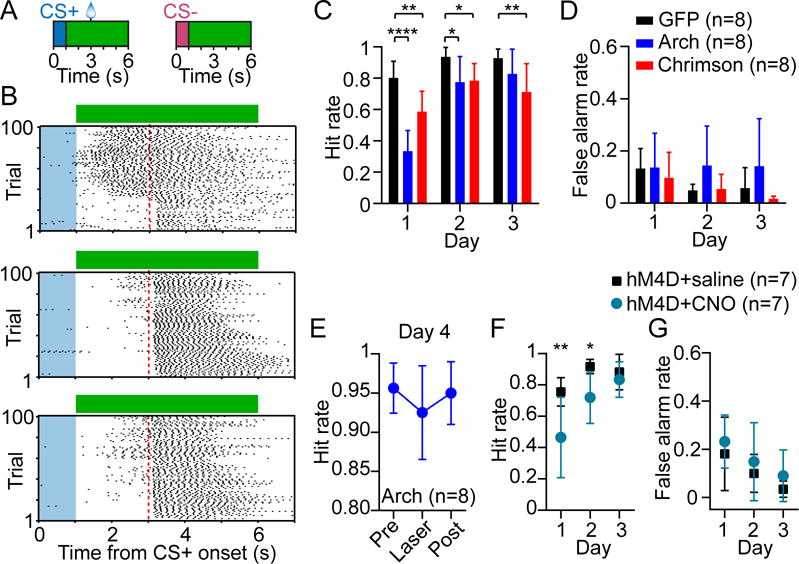
Figure 3. Striatal PV Interneurons Control Behavior during Early Reward Conditioning.

(A) Stimulus-reward conditioning and optogenetic stimulation paradigm. Green bars denote the duration of bilateral optical stimulation.
(B) CS+ trial lick raster from day 1 of training of a PV-GFP (top), PV-Arch (middle), and PV-Chrimson (bottom) mouse receiving optical stimulation. Blue shaded area represents cue duration, green bar represents laser duration, dashed red line represents reward delivery time.
(C) Optogenetically suppressing or over-activating PV interneurons (n = 8 mice per group) selectively disrupted reward-anticipatory behavior (hit rate, two-way ANOVA, group effect: F2,21 = 15, p < 0.0001; time effect: F2,42 = 43.7, p < 0.0001). Post hoc Bonferroni’s test revealed that hit rate was selectively reduced by PV suppression on day 1 and 2 of training relative to GFP controls, but was reduced across all days by PV over-activation.
(D) False alarm rate was not significantly affected by optogenetic manipulation (two-way ANOVA, group effect: F2,21 = 1.7, p = 0.22; time effect: F2,42 = 6.6, p = 0.003).
(E) In this cohort, PV-Arch animals (n = 8) were trained without laser for 3 days and tested with laser in the middle of day 4. The hit rate was not significantly affected (one-way ANOVA, F2,14 = 2.5, p = 0.12). Absolute maximum difference of the 95% confidence intervals = 0.07.
(F) Chemogenetically inhibiting PV interneurons using hM4D and CNO (n = 7 mice per group) selectively disrupted hit rate in the early stage of training (two-way ANOVA, group effect: F1,12 = 8.2, p = 0.014; time effect: F2,24 = 20.8, p < 0.0001). Post hoc Bonferroni’s test revealed that hit rate was selectively reduced on day 1 and 2.
(G) False alarm rate was not significantly affected by chemogenetic inhibition (two-way ANOVA, group effect: F1,12 = 1.4, p = 0.25; time effect: F2,24 = 7, p = 0.004). Data in (C–G) are represented as mean ± SD. See also Figure S3. *p < 0.05; **p < 0.01; ****p < 0.0001.
