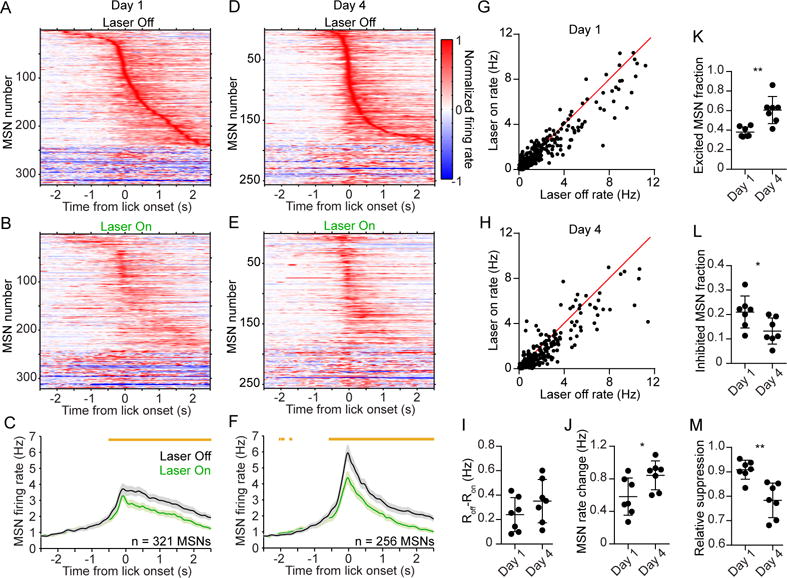
Figure 4. Experience Diminishes the Relative Influence of PV Interneurons on Preparatory MSN Activity.

(A) Mean baseline-subtracted and normalized firing rate as a function of time of 321 MSNs recorded on day 1 of training, aligned to the first lick during hit trials without laser. Units are ordered by their latency to peak firing.
(B) Same as (A) but showing hit trials with laser. Note that the rate is normalized to the maximum firing during trials without laser. The order of units is the same as that of (A).
(C) Comparison of the mean firing rate of the population in (A–B) during laser off (black) and laser on (green) conditions. Orange bars above the plots denote time bins with significantly different off-on firing rate (paired t-test, p < 0.01).
(D) Mean baseline-subtracted and normalized firing rate as a function of time of 256 MSNs recorded on day 4 of training, aligned to the first lick during hit trials without laser. Units are ordered by their latency to peak firing.
(E) Same as (D) but showing trials with laser. Note that the rate is normalized to the maximum firing during trials without laser. The order of units is the same as that of (D).
(F) Comparison of the mean firing rate of the population in (D–E) during laser off and laser on conditions. Data in (C and F) represent mean ± SEM.
(G) Comparison of median firing rate during a 1 s licking-preparatory period, between laser off and laser on conditions. The firing rate of the MSN population was significantly attenuated by optogenetic suppression of PV interneurons (Wilcoxon matched pairs signed-rank test, p < 0.0001). Each data point represents one MSN recorded on day 1 of training.
(H) Same as (G) but for day 4 of training. The firing rate of the MSN population was significantly attenuated by optogenetic suppression of PV interneurons (Wilcoxon matched pairs signed-rank test, p < 0.0001).
(I) The median level of MSN firing rate suppression per animal (Roff–Ron) did not significantly change from day 1 to day 4 (Mann-Whitney test, p = 0.26).
(J) The median level of preparatory MSN activity per animal increased from day 1 to day 4 (Mann-Whitney test, p = 0.026). The firing rate change is with respect to baseline activity.
(K) The fraction of MSNs per animal that were significantly excited during the preparatory period increased from day 1 to day 4 (Mann-Whitney test, p = 0.002).
(L) The fraction of MSNs per animal that were significantly inhibited during the preparatory period decreased from day 1 to day 4 (Mann-Whitney test, p = 0.019).
(M) The relative suppression factor per animal, which quantifies the change in MSN activity due to PV interneuron suppression relative to the total MSN preparatory activity, decreased from day 1 to day 4 (Mann-Whitney test, p = 0.002). Data in (J–L) are derived from non-laser trials, and each data point represents one animal (n = 7 mice per group). See also Figures S4, S5. *p < 0.05; **p < 0.01.
