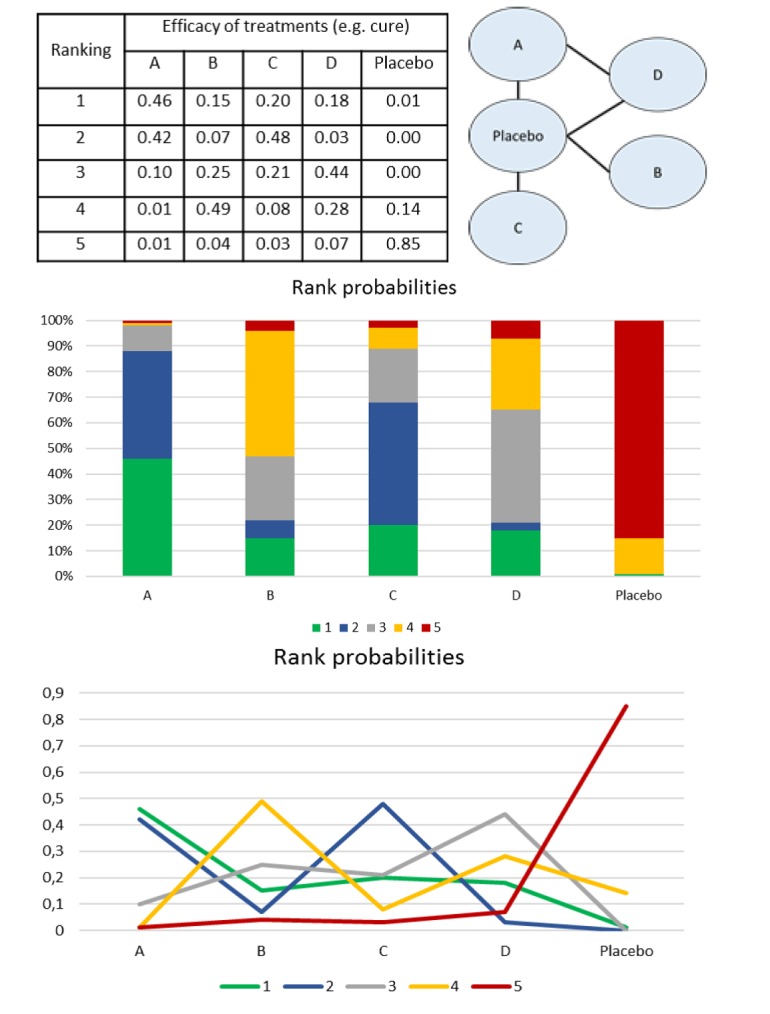
Figure 6.

Rank probabilities representations.
For a network with five nodes (A, B, C, D and placebo), after the interpretation of the model of consistency (figure 5), we can order the intervention using different tools (graphics, tables). In each one of them, the probabilities of each intervention to be the best (1st in the rank), second best, third, fourth and last in the rank (5th position - worst therapy) are calculated. First panel: probabilities are given such as percentages. Rank probabilities sum to one, both within a rank over treatments (horizontal) and within a treatment over ranks (columns). Intervention A has 46% (0.46) of probability of being the best drug (first in the rank), followed by C (48%), D (44%), B (49%) and placebo (85%). This same scenario is presented in the second panel and third panels (as a graphic illustration) where each intervention has a probability to be part of the first, second, third, fourth, fifth positions.
