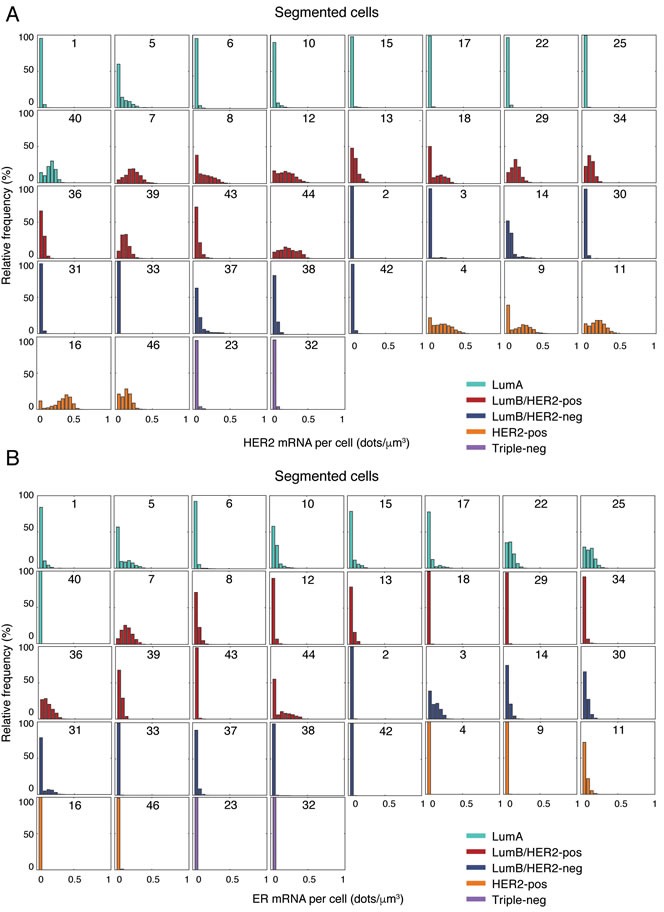
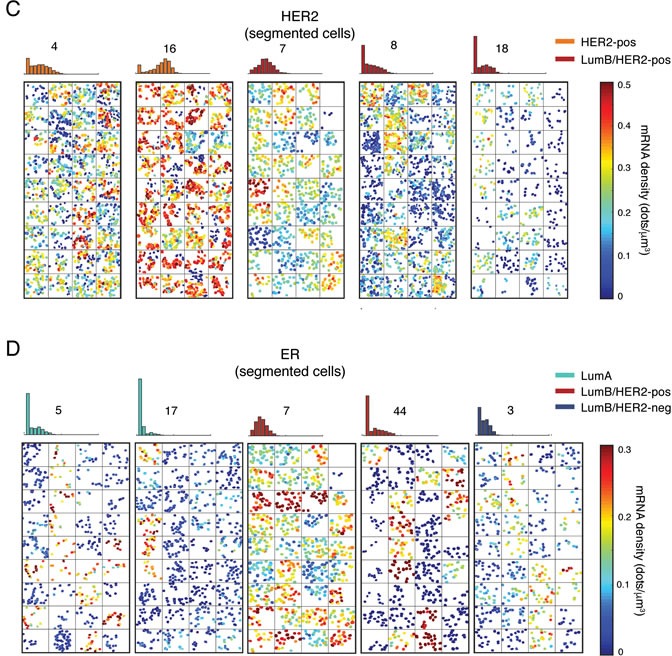
Figure 3. HER2 and ER gene expression in single cells.


A. Distribution of the HER2 mRNA density per cell in 36 segmented cases grouped by molecular subtype. The number in each box indicates the case ID (see Supplementary Table 3). B. Same as in A., but for ER. C. Representative spatial HER2 mRNA patterns in selected cases belonging to the HER2-positive or Luminal B/HER2-positive molecular subtype. For each case, we randomly selected 36 images and plotted all the cells segmented in each image (nucleus expansion margin = 20 px; threshold = 0 dots/cell) as polygons filled with a different color depending on the mRNA density in the cell. Finally, we arranged the plots in a 9 × 4 matrix plot, as shown here. Therefore, adjacent plots in the matrix must not be interpreted as coming from physically adjacent regions in the tumor. The histogram on top of each matrix shows the distribution of mRNA density among all the cells in the case, independently of their location (same as in A. and B.). The number above each histogram represents the case ID (see Supplementary Table 3). The color bar on the right shows the colors encoding for the mRNA density in each cell. D. Same as in C., but for ER. Similar maps for all the 36 segmented cases can be browsed on the supporting website, http://tumorheterogeneity.eu/.
