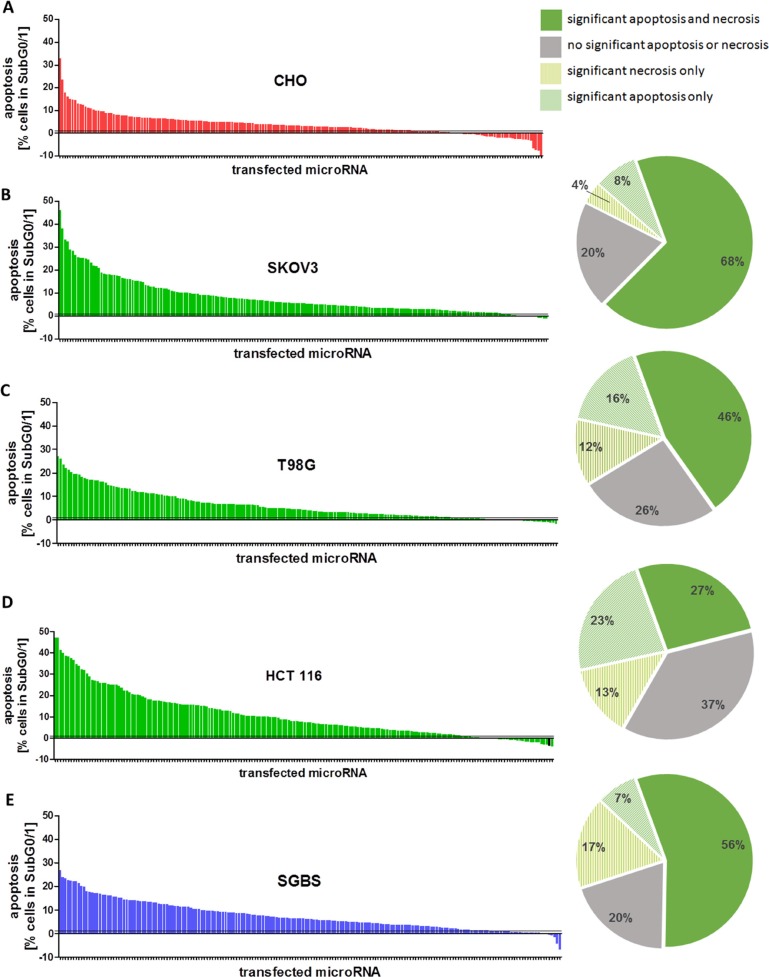
Figure 1.
(A–E) Apoptosis rates after miRNA mimic transfection. Overview of the normalized results of all 188 miRNA mimics selected from the initial screening in CHO cells. The screening was performed in a 96 well plate with a total volume of 100 μl, a final concentration of 50 nM miRNA mimics and 0.4 μl ScreenFect®A. The cells were seeded 24 h before transfection and analyzed 72 h after transfection by Nicoletti staining followed by flow cytometry analysis. The mean values [n = 3] were normalized by the values of the NT control of the respective cell lines (A) CHO, (B) SKOV3, (C) T98G, (D) HCT 116 and (E) SGBS and arranged from strong to weak apoptotic effect (left panel). The respective numbers of miRNAs which induced significant pro-apoptotic or necrotic effects (p < 0.05) are illustrated by cake charts as percentage of the candidates from the miRNA sublibrary tested in total (right panel).

