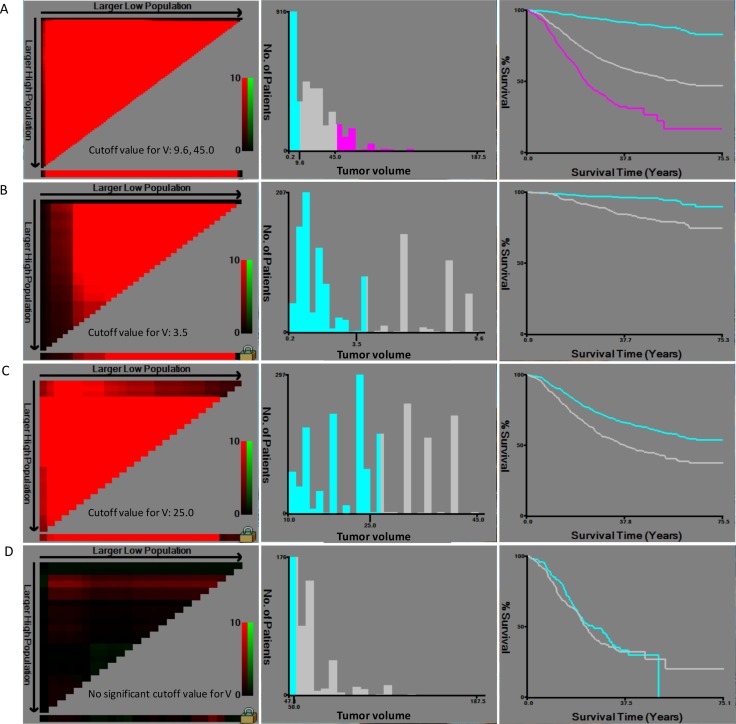
Figure 1. Calculation of cutoff points of tumor volume by X-tile in training set.
(A) Three subgroups were built according to the 2 optimal cutoff points (9.6, 45.0, P < 0.001); (B) Two subgroups were built according to the optimal cutoff point (3.5, P < 0.001) for patients with tumor volume between 0 and 9.6. (C) Two subgroups were built according to the optimal cutoff point (25.0, P < 0.001) for patients with tumor volume between 9.6 and 45.0. (D) No cutoff point was obtained for patients with tumor volume exceed 45.0.

