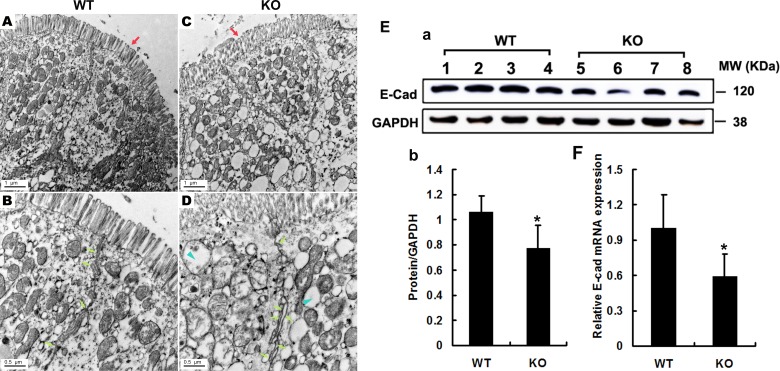
Figure 7. Electron microscopy analysis of the integrity of intestinal barrier.
(A–D) Intestinal villi in WT mice were intensive, in alignment (A) and tight junction were normal (B, arrows), whereas they were sparse, disorder (C, red arrows) and broadening intercellular space in Adamts18 KO littermates (D, fluorescein arrow). In addition, cytoplasm in KO mice contains a large number of mitochondria vacuolar degeneration (D, blue arrowheads). (E–F) Expression levels of E-cadherin determined by Western blotting and RT-PCR and quantization of relative expression levels of the proteins and mRNA. Values are means of three replicated experiments. Statistical significance: *P < 0.05. WT, wide-type; KO, knock-out. Scale bar (A, C = 1 μm, B, D = 0.5 μm respectively).

