
Figure 4. Evaluating candidate gene regulation of sensitivity to cisplatin treatment.
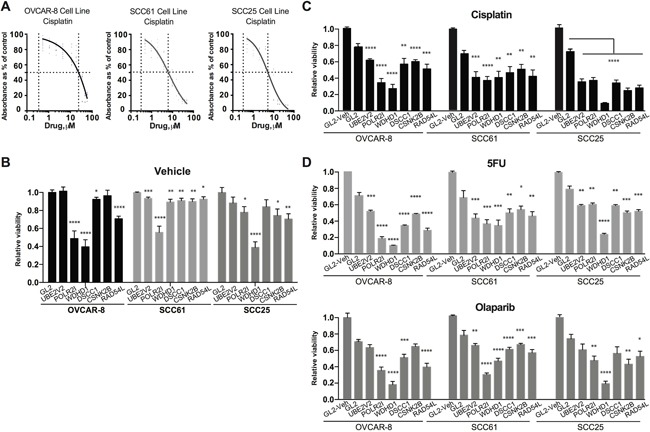
A. IC50 determination for cisplatin for the OVCAR-8, SCC61, and SCC25 cell lines. B. Relative viability of OVCAR-8, SCC61, and SCC25 cell lines assessed by CellTiterBlue (CTB) following treatment with negative control siRNA (GL2) or siRNAs targeting the indicated genes. Data are normalized to CTB values for GL2. C. Relative viability of cells treated with the indicated siRNAs 72 hours after treatment with IC20-30 levels of cisplatin. GL2/vehicle treated cells are included as reference. D. Data as for C., except following treatment of cells with 5-FU (top) or olaparib (bottom). *, P < 0.05, **, P <0.01, ***, P <0.001, ****, P <0.0001 for all graphs.