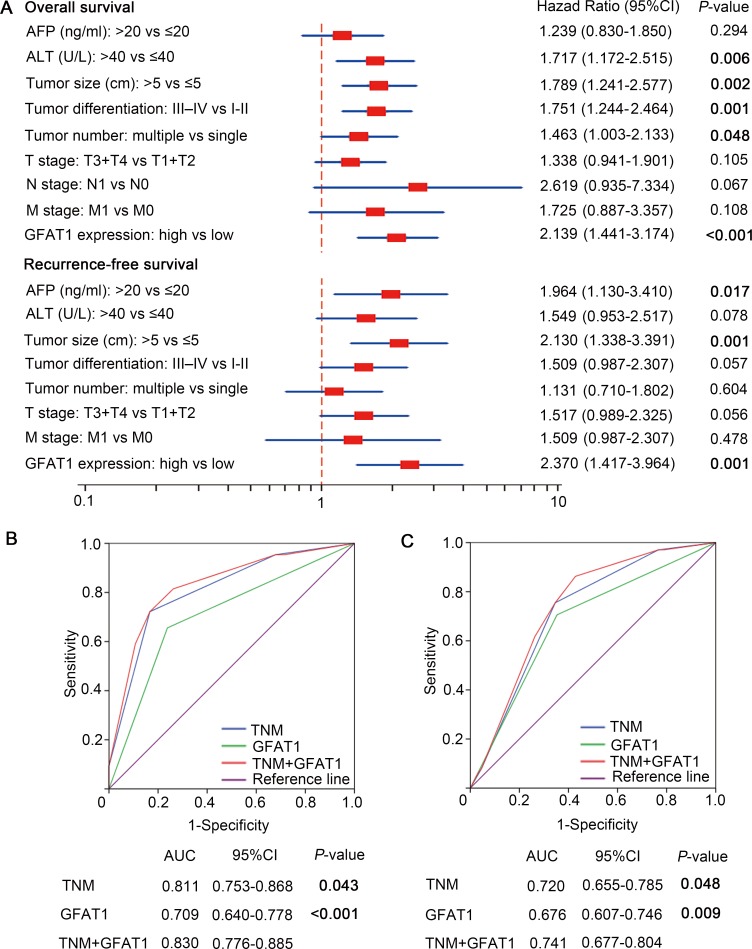
Figure 3. Multivariate Cox regression analysis and ROC analyses for predictive effect of GFAT1.
(A) Independent prognostic factors were identified by Multivariate Cox analysis for OS and RFS. (B and C) ROC analysis of the sensitivity and specificity for the predictive value of TNM model, GFAT1 expression model and the combined TNM+GFAT1 model of OS (B) and RFS (C). P < 0.05 was considered statistically significant.

