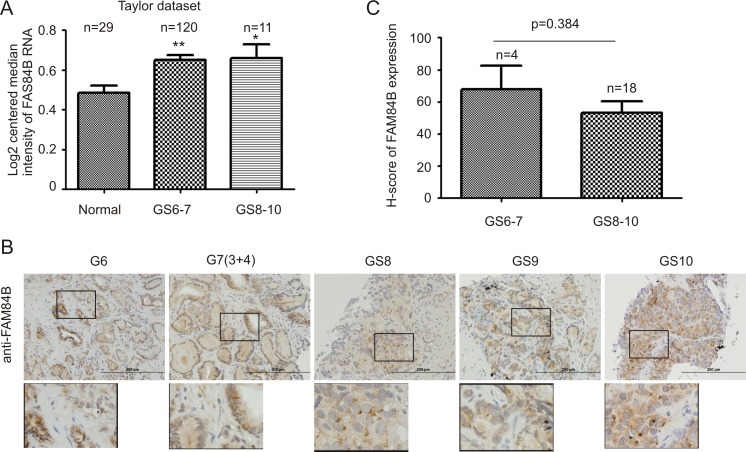
Figure 5. FAM84B upregulation does not associate with Gleason score (GS) advancement.
(A) FAM84B mRNA expression data were extracted from the Taylor dataset in the OncomineTM database, and were analyzed as low grade (GS6-7) or high grade (GS8-10) PCs. *p < 0.05 and **p < 0.01 in comparison to normal prostate tissues (2-tailed Student's t-test). (B) IHC staining for FAM84B in 22 primary PC tissues (Supplementary Table 1). Typical images for tumors with the indicated GS are shown. Scale bars represent 200 μm (See Supplementary Figure 5 for additional images). (C) IHC staining was quantified through ImageScope software. Average HScores ± SDs are graphed (for detailed scores, See Supplementary Table 1). Statistical analyses were performed using Student's t-test.

