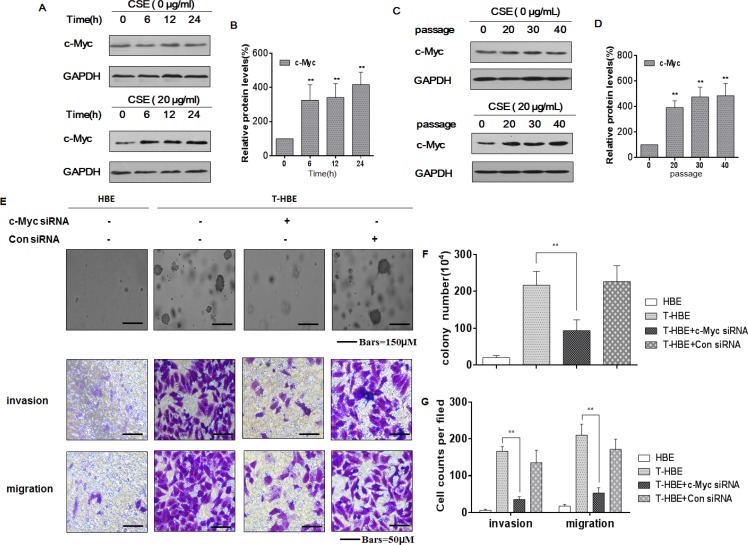
Figure 1. CSE increases the levels of c-Myc, affecting the degree of malignancy and the invasion/migration capacity of transformed HBE cells.
Abbreviations: HBE, passage-control HBE cells; T-HBE, CSE-transformed HBE cells. Densities of bands were quantified by Eagle Eye II software. GAPDH levels, measured in parallel, served as controls. HBE cells were exposed to CSE (0 or 20 μg/mL) for 0, 6, 12, or 24 h. (A) Western blots were performed, and (B) relative protein levels (means ± SD, n = 3) of c-Myc were determined. ** P < 0.05, different from control HBE cells. HBE cells were exposed to 0 or 20 μg/mL CSE for 0, 20, 30, or 40 passages. (C) Western blots were performed, and (D) relative protein levels (means ± SD, n = 3) of c-Myc were determined. *P < 0.05, different from passage-control HBE cells. T-HBE cells were transfected for 24 h with c-Myc siRNA or control siRNA at a final concentration of 100 ppm. (E) Representative images of colony formation in soft agar (upper, bars = 150 μm), cell invasion (middle, bars = 50 μm), and cell migration (lower, bars = 50 μm) were prepared. The numbers (means ± SD, n = 3) of colonies formed (F) and of invading or migrating cells (G) were quantified. **p < 0.05, different from T-HBE cells in the absence of c-Myc siRNA.

