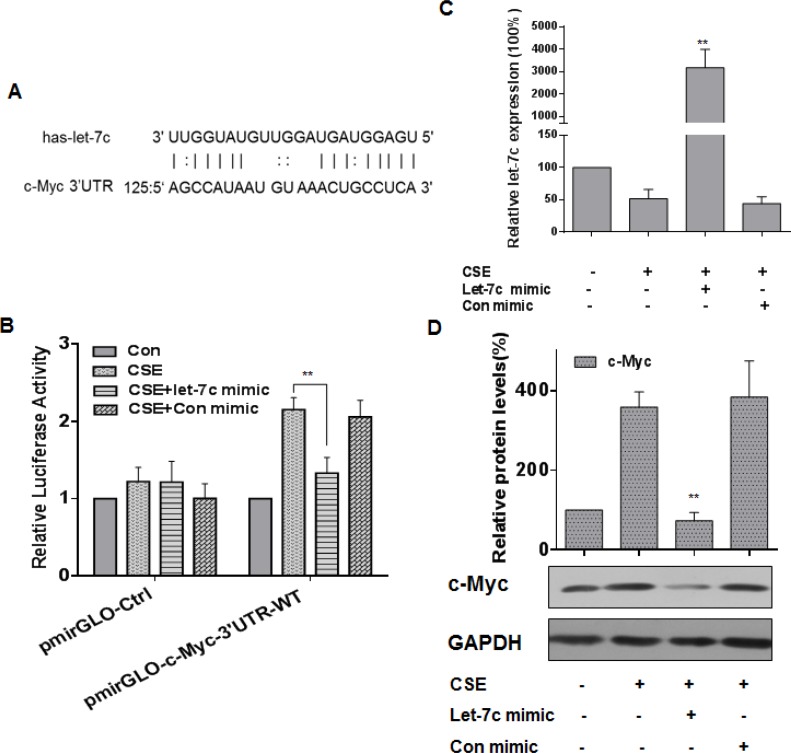
Figure 4. let-7c is involved in CSE-induced increases of c-Myc expression in HBE cells.
Densities of bands were quantified by Eagle Eye II software. GAPDH levels, measured in parallel, served as controls. (A) Schematic graph of the binding sites of let-7c in the 3′UTR of c-Myc. HBE cells were exposed to CSE (0 or 20 μg/mL) for 24 h after they were transfected with 50 nM let-7c mimic or control mimic for 24 h. HBE cells were co-transfected with pmirGLO-c-Myc-3′UTR -WT or pmirGLO-Ctrl and with 50 nM let-7c mimic or control mimic for 24 h, then exposed to CSE (0 or 20 μg/mL) for 24 h. (B) Luciferase activity was measured at 24 h after transfection. Means of triplicate assays with standard deviations were presented. (C) The levels (means ± SD, n = 3) of let-7c were determined by quantitative RT-PCR. **P < 0.05, different from CSE-treated HBE cells in the absence of the let-7c mimic. (D) Western blots and relative protein levels (means ± SD, n = 3) of c-Myc were determined. **P < 0.05, different from CSE-treated HBE cells in the absence of the let-7c mimic.

