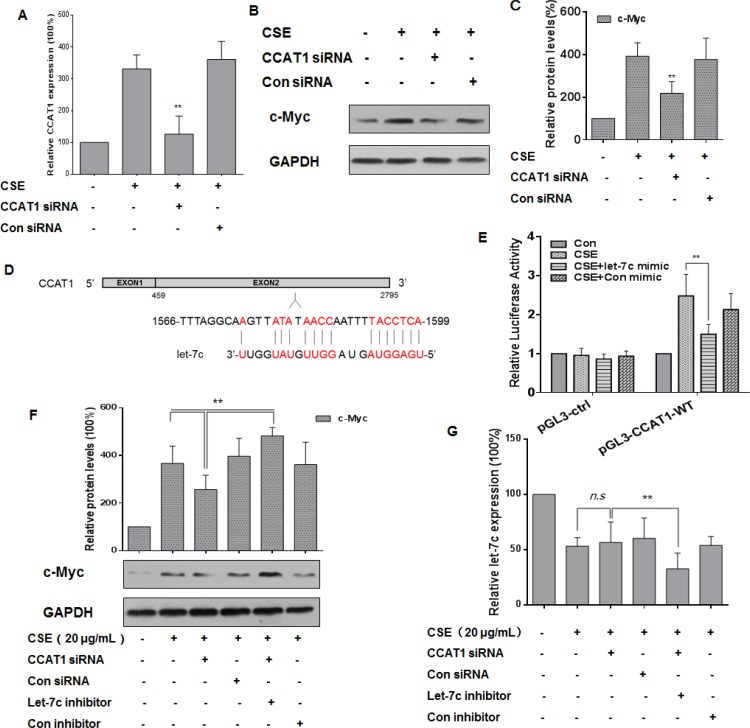
Figure 5. CCAT1 is involved in the CSE-induced elevation of c-Myc expression though let-7c in HBE cells.
Densities of bands were quantified by Eagle Eye II software. GAPDH levels, measured in parallel, served as controls. HBE cells were cultured in the presence of control siRNA or CCAT1 siRNA (100 ppm) for 24 h and then exposed to CSE (20 μg/mL) for 24 h. (A) The levels (means ± SD, n = 3) of CCAT1 were determined by quantitative RT-PCR. (B) Western blots and (C) relative protein levels (means ± SD, n = 3) of c-Myc were determined. **P < 0.05, different from CSE-treated HBE cells in the absence of CCAT1 siRNA. (D) Predicted binding sites for let-7c in CCAT1. HBE cells were co-transfected with pGL3-CCAT1-WT or pGL3-ctrl and with 50 nM let-7c mimic or control mimic for 24 h, then exposed to CSE (0 or 20 μg/mL) for 24 h. (E) Luciferase activity was measured at 24 h after transfection. Means of triplicate assays with standard deviations were presented. HBE cells were exposed to CSE (0 or 20 μg/mL) for 24 h after cells were co-transfected with CCAT1 siRNA and let-7c inhibitor for 24 h. (F) Western blots and relative protein levels (means ± SD, n = 3) of c-Myc were determined. **P < 0.05, different from CSE-treated HBE cells in the presence of CCAT1 siRNA. (G) The levels (means ± SD, n = 3) of let-7c were determined by quantitative RT-PCR. ** P < 0.05, different from CSE-treated HBE cells in the presence of CCAT1 siRNA. ‘n.s.’ indicates no significant difference from CSE-treated HBE cells in the presence of CCAT1 siRNA.

