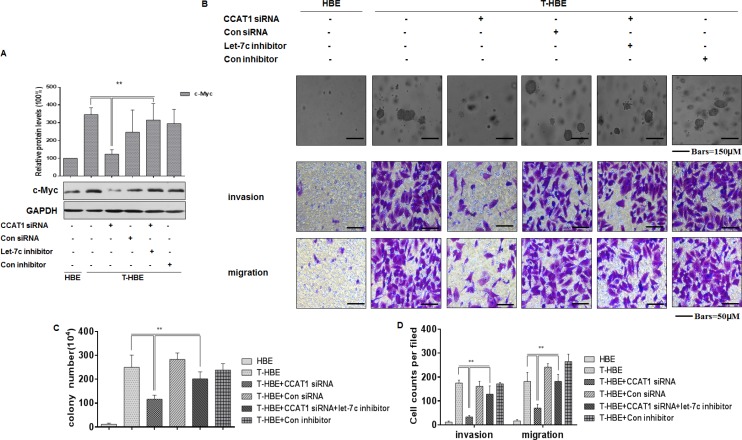
Figure 6. CCAT1, via let-7c, influences the degree of malignancy and the invasion/migration capacity of CSE transformed-HBE cells.
Abbreviations: HBE, passage-control HBE cells; T-HBE, CSE-transformed HBE cells. T-HBE cells were exposed to CCAT1 siRNA or control siRNA and to let-7c inhibitor or control inhibitor for 24 h. (A) Western blots and relative protein levels (means ± SD, n = 3) of c-Myc were determined. **P < 0.05, different from CSE-treated HBE cells in the presence of CCAT1 siRNA. (B) Representative images of colony formation in soft agar (upper, bars = 150 μm), cell invasion (middle, bars = 50 μm), and cell migration (lower, bars = 50 μm) were prepared. The numbers (means ± SD, n = 3) of colonies formed (C) and invading/migrating cells (D) were quantified. **P < 0.05, different from T-HBE cells in the presence of CCAT1 siRNA.

