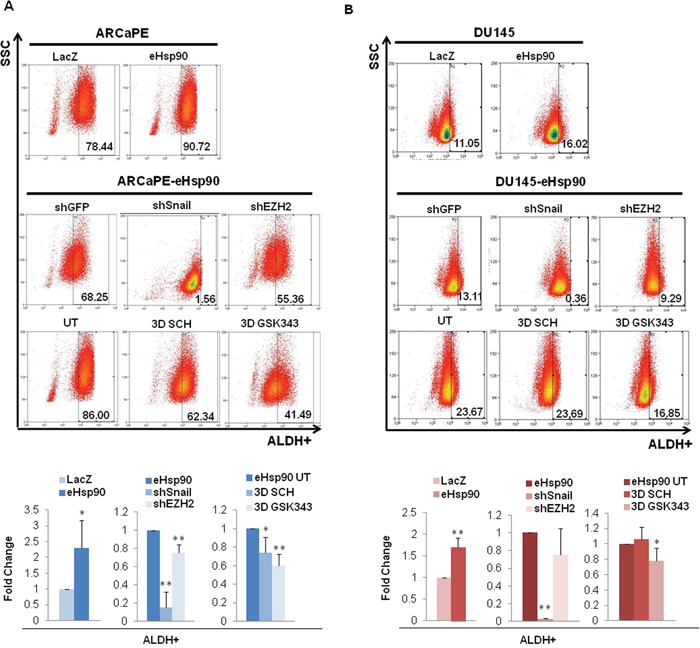
Figure 3. eHsp90 enhances ALDH activity via Snail and EZH2.

A, B. Top panels show representative flow cytometry scatter plots for the ALDEFLUOR assay of ARCaPE-LacZ relative to ARCaPE-eHsp90 (A) and DU145-LacZ relative to DU145-eHsp90 (B). Middle panels show representative scatter plots for ARCaPE-eHsp90 and DU145-eHsp90 transduced with either an shGFP vector control, shSnail, or shEZH2. Lower panels show representative scatter plots for ARCaPE-eHsp90 and DU145-eHsp90 treated with 100 nM SCH or 500 nM GSK343 over a 3 day period. Comparisons included eHsp90-expressing cells relative to the matched LacZ control. As indicated, additional treatments or cell derivatives were compared relative to the matched untreated eHsp90-expressing cells. Combined analysis of replicate assays are shown in accompanying graphs. All statistics were performed using the Student's t-test. * = p<0.05, ** p<0.01.
